How To Catch Trends With Heiken-Ashi Candlestick Analysis
By Galen Woods ‐ 8 min read
Looking for a more effective candlestick analysis? Try Heiken-Ashi candlestick charts. It complements candlestick patterns to pinpoint entries and exits.
Candlestick patterns offer reversal signals that are effective when you combine them with other analyses. However, there are dozens of candlestick patterns, including exotic patterns that rarely form. Is there an alternative way to catch trends with candlestick patterns? Yes. Let’s get to know the Heiken-Ashi candlestick chart.
A Heiken-Ashi (or Heikin-Ashi) candlestick chart is a tool that offers a unique perspective on price action.
In this tutorial, you’ll learn:
- What is an Heiken-Ashi candlestick?
- How to interpret Heiken-Ashi charts?
- How to apply it in actual trading scenarios to profit from trends?
Before you proceed, make sure you have a solid understanding of standard candlestick charts.
What is Heiken-Ashi Candlestick?
According to Investopedia, Heiken-Ashi means “average bar” in Japanese. Hence, it’s not surprising that they produce a smoothed version of the standard candlestick chart.
Let’s examine its formula to get a better idea of what this concept brings to the table.
Heiken-Ashi Formula
Heiken-Ashi charts are candlestick charts derived from standard candlesticks.
To compute Heiken-Ashi candlesticks, follow the four formula below:
- HA Close = Average of Open, High, Low, Close
- HA Open = Mid-point of previous HA bar
- HA High = Highest of High, HA Close, HA Open
- HA Low = Lowest of Low, HA Close, HA Open
As you see from the formula above, Heiken-Ashi candlesticks consider both current and past price data.
Hence, it produces a smoothing result like that of a moving average. Heiken-Ashi’s essential contribution is that it irons out small price fluctuations to highlight price trends.
A moving average smooths a price chart as well. So what is the difference between a moving average and a Heiken-Ashi chart?
While the smoothing effect of a moving average depends on its look-back period, the Heiken-Ashi chart does not require a look-back period. In this sense, it is simpler and offers a more consistent result.
Chart Example
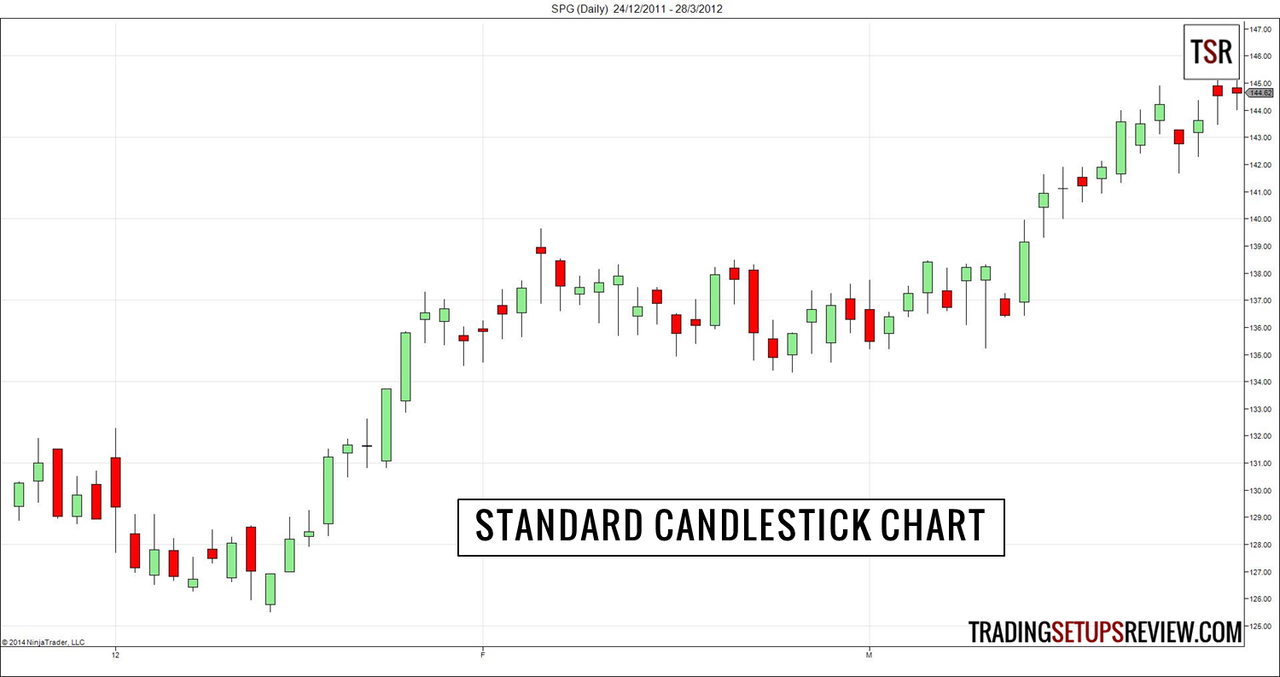
It’s best to appreciate the real impact of Heiken-Ashi visually. Let’s compare a standard candlestick chart with its Heiken-Ashi equivalent.
The chart below is the standard chart for candlestick analysis.
This chart shows the same market over the same period with the Heiken-Ashi overlay.
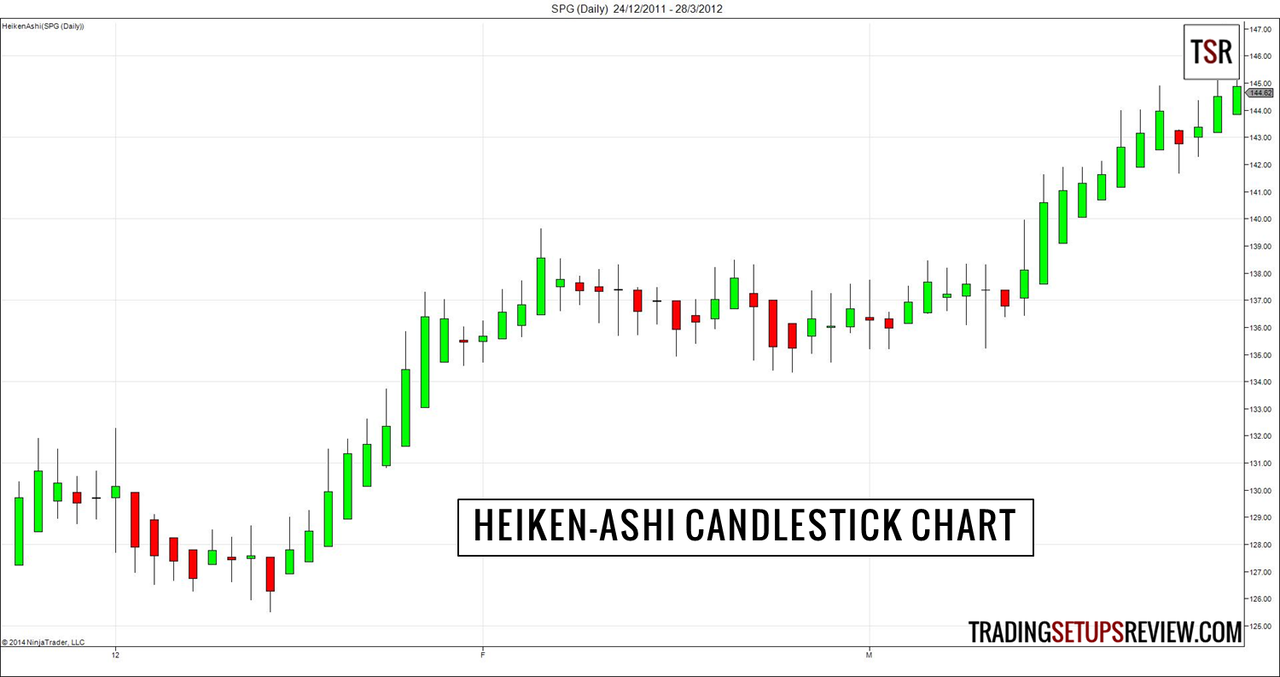
If this is the first time you are looking at a Heiken-Ashi chart, you might think it is the Holy Grail you are searching for.
With such smooth and wavy price action, trading should be a lot easier.
That is true, only if Heiken-Ashi charts show actual prices that you can buy and sell at. But they do not.
Despite being plotted as candlesticks, Heiken-Ashi charts do not directly represent prices we can buy and sell at. They largely overlap with actual traded prices, but they are not the same.
We derive Heiken-Ashi charts from price action. Thus, they are trading indicators in the form of candlestick charts.
Since we cannot actually trade at the prices represented in the Heiken-Ashi chart, what is it good for?
How To Interpret Heiken-Ashi Candlestick Charts?
On standard candlestick charts, we observe the candle body and shadows to find candlestick patterns.
This process involves looking out for various possibilities on the chart. Hence, it can feel overwhelming at times.
After a transformation to Heiken-Ashi candlesticks, you can adhere to a simplified analytical process.
Basic Heiken-Ashi Guidelines
- Green candlesticks - bullish
- Green candlesticks without lower shadow - strongly bullish
- Red candlesticks - bearish
- Red candlesticks without upper shadow - strongly bearish
- Dojis with substantial upper and lower shadows - neutral (congestion or reversal)
Except for Dojis, the Heiken-Ashi candlesticks lend themselves to straightforward interpretation. This takes an enormous burden off a candlestick trader.
Let’s go through these guidelines by example, with the chart below. (WMT - Walmart Daily)
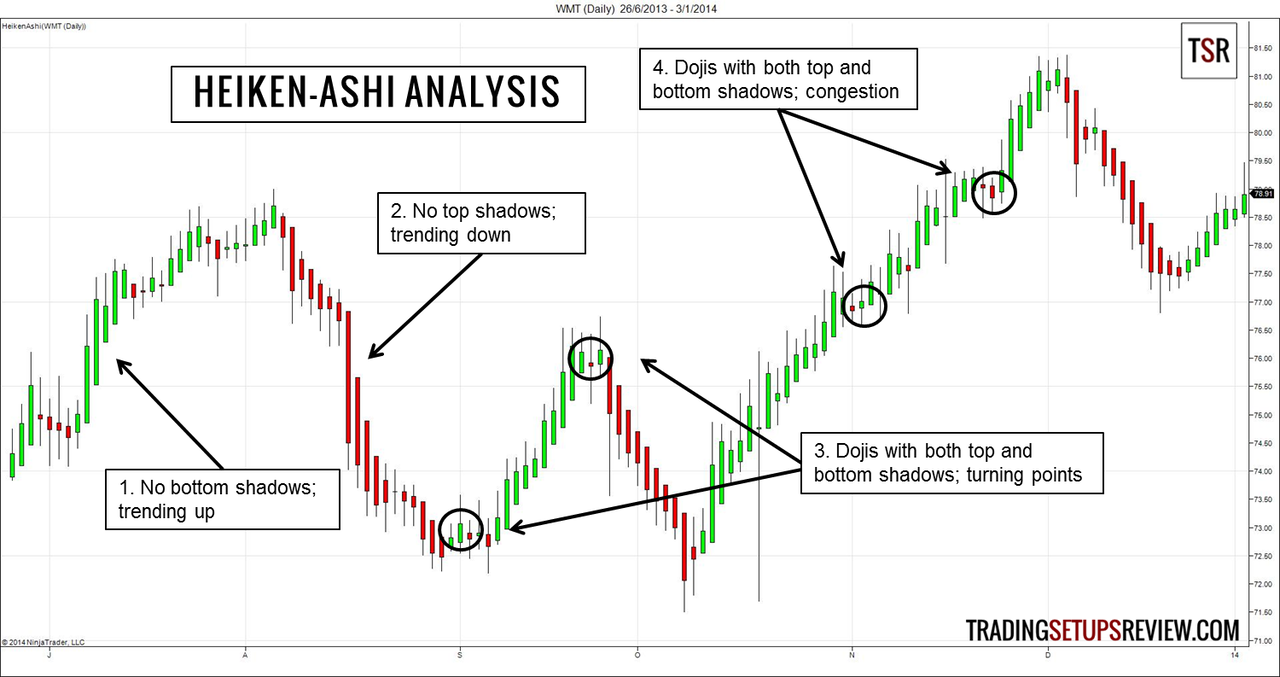
- When prices are trending up, you find consecutive bullish Heiken-Ashi candlesticks with no lower shadows.
- When prices are trending down, you see consecutive bearish Heiken-Ashi candlesticks with no upper shadows.
- Doji-like bars with both lower and upper shadows are possible turning points.
- The Dojis also appear in price congestion or trend pullback areas.
As you can see, with Heiken-Ashi, it’s straightforward to describe the current price action.
- Is the market trending?
- Is the market trending strongly?
- Is it hesitating?
With this unique chart type, you can answer these questions quickly and with ease.
How To Apply Heiken-Ashi In Your Trading?
The previous section covered the market analysis. Here, we will focus on turning our analysis into trading decisions.
We will look at the following Heiken-Ashi applications:
- Finding turning points
- Letting profits run
- Timing long-term investments
Finding Market Turning Points
Finding turning points with Heiken-Ashi charts involves two steps.
First, find Dojis on a Heiken-Ashi chart. This step pinpoints a zone for us to focus on.
We have already done this by marking out the Dojis on the Walmart chart above (in Point #3 and #4).
The Dojis highlight zones of possible reversal or continuation where we can find trading opportunities.
Next, switch back to the standard candlestick chart and look for reversal candlestick patterns.
The chart below shows the same WMT daily chart. We have circled the candlestick patterns in the Heiken-Ashi Doji zones.
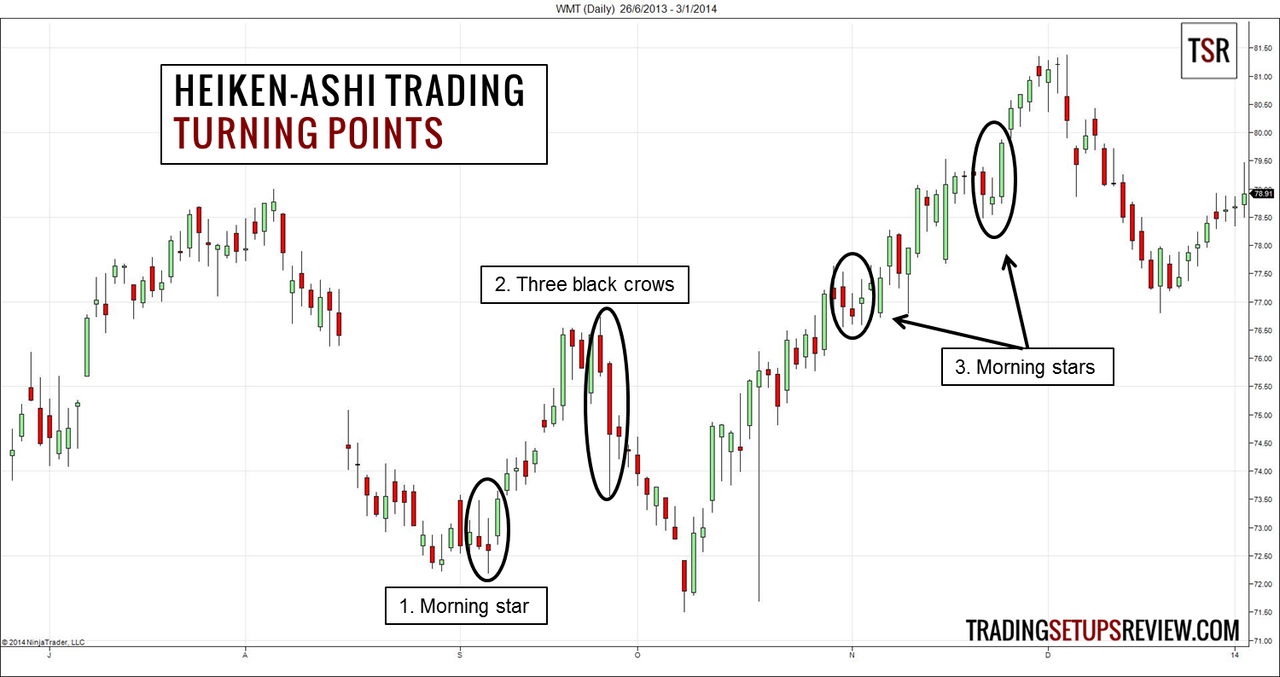
- There was a Morning Star candlestick pattern here. It is a bullish three-bar reversal candlestick pattern.
- After the bullish swing that filled the earlier price gap, Heiken-Ashi Dojis coincided with a Three Black Crows pattern. This bearish candlestick pattern led to the downswing, which ended with a double bottom.
- This chart is twinkling with stars. In the other two trading zones, we found Morning Star patterns that pushed the bullish trend further.
This trading approach is not perfect.
Return your attention to the first Morning Star candlestick pattern at the chart’s bottom (Point #1). The two bars before it formed a Dark Cloud Cover pattern, which is bearish. Taking that signal to go short will result in a losing trade.
Nonetheless, Heiken-Ashi charts are nifty tools for quickly identifying areas of interest for further candlestick analysis.
Let Your Profits Run with Heiken-Ashi Analysis
- Do you have a problem letting your profits run?
- Do you watch over each trade with an eagle eye?
- Do you feel stressed by each price tick?
If you answered yes to any of the questions, you’d benefit from the Heiken-Ashi chart.
Let’s take a look at a simple method of taking profits with the Heiken-Ashi chart. When a Heiken-Ashi candlestick goes against our trade appears, we exit.
- If you are in a long trade, exit when you see a bearish Heiken-Ashi candlestick.
- If you’re in a short trade, exit when a bullish Heiken-Ashi candlestick forms.
The chart below marks the exit points for both long and short trades using this straightforward tactic. While these exit points are not perfect, they are adequate when coupled with a reasonable stop-loss.
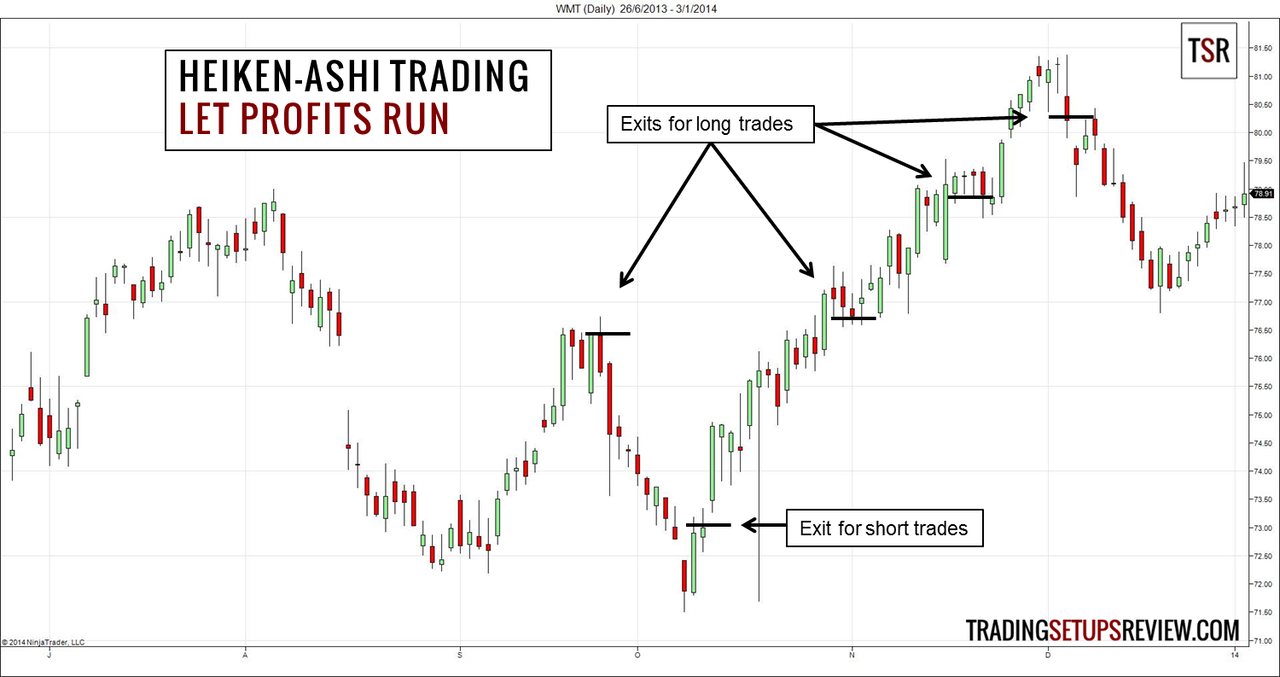
If you’ve had applied the same exit method using a standard candlestick chart, you would have exited with smaller profits.
It’s common to feel anxious watching the market move against you. The anxiety might cause you to exit earlier than you should.
Try switching to a Heiken-Ashi chart to monitor your trade. This calm chart is what you’ll see. 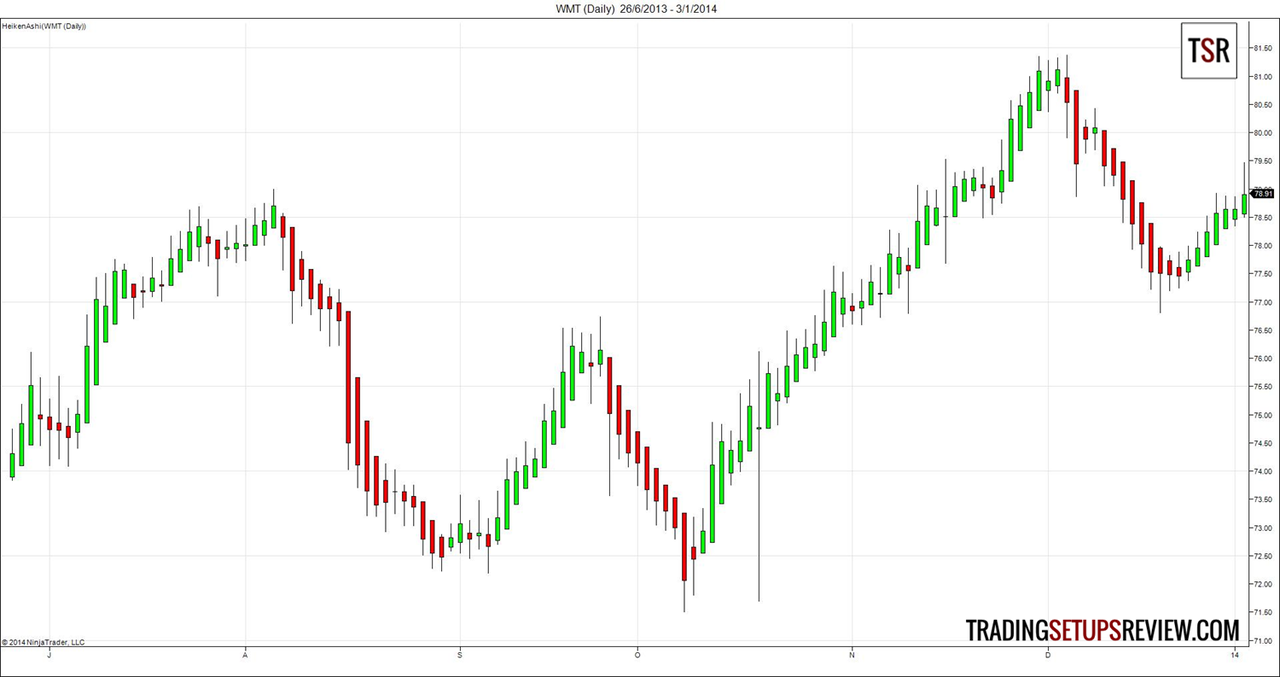
Much easier to let your profits run. Right?
Long-Term Investment Timing
For your long-term investments, the exact timing is less critical. This is because, for such positions, you are more likely to have formed a bias based on fundamental analysis and will not use a strict technical stop-loss.
The Heiken-Ashi shines in this application as it highlights the trend changes you can use for timing your long-term positions. It saves you from over-analyzing the technicals.
The chart below shows the market sell-off in March 2020, triggered by the coronavirus and other concerns. Note that this is a weekly chart.
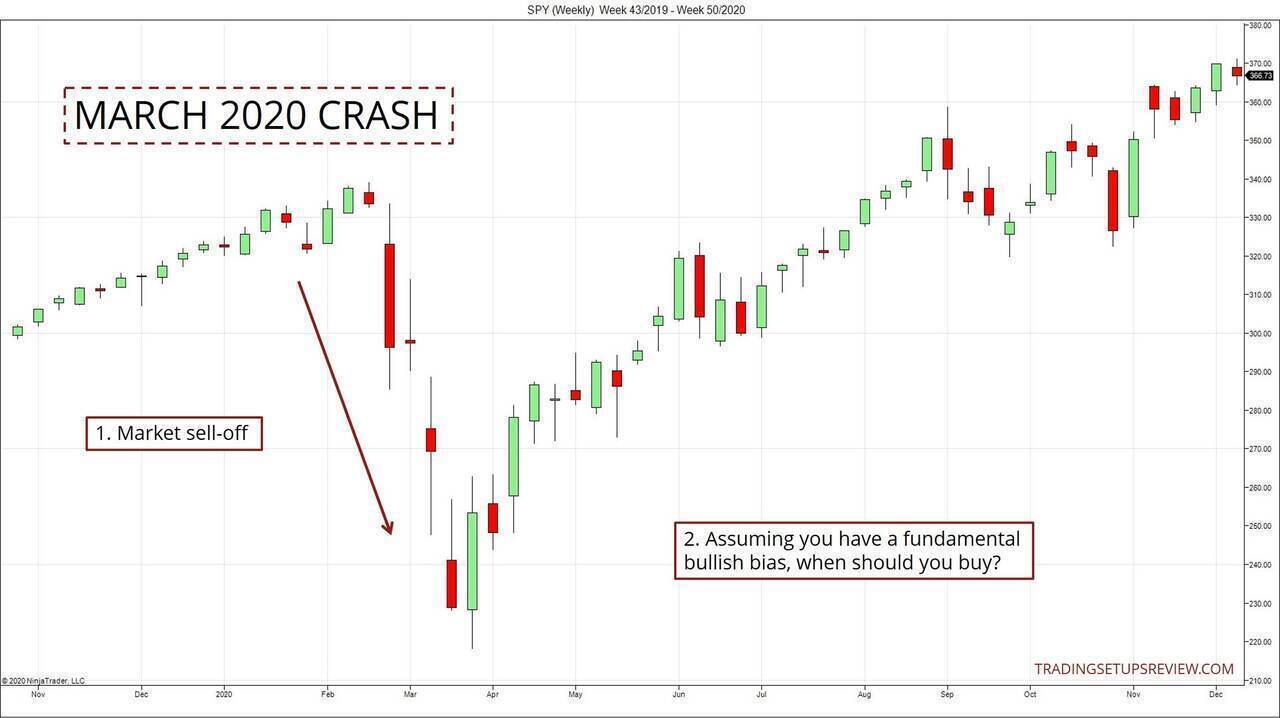
Let’s assume that:
- You hold the opinion that the market overreacted, and you remain bullish.
- You would like to take the chance to accumulate a long-term position in SPY.
- But you do not want to catch falling knives. (You hope to see at least some bullishness before entering the market.)
What should you do? Is performing close candlestick analysis worth the effort? Or is there a more straightforward option?
Let’s take a look at the Heiken-Ashi version of the same SPY chart.
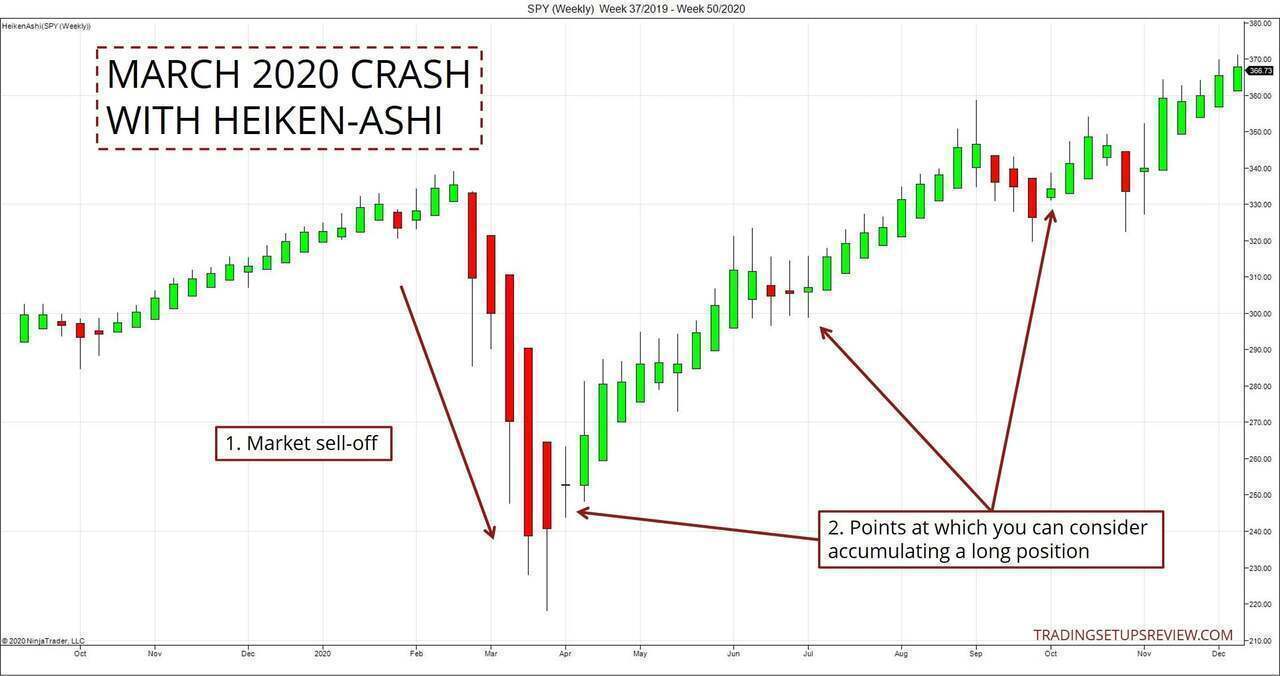
At each point when the Heiken-Ashi candlestick turned green, you could increase your market position. This gives you a system to increase your position each time you detect bullishness in the market.
(For practice, load up a weekly chart showing the 2008/2009 crash and see how Heiken-Ashi helps detect bullishness. The 2008 crash lasted much longer and hence offers a very educational analytical exercise.)
Conclusion: Power of Heiken-Ashi Charts
If we depend solely on the Heiken-Ashi chart, we might miss key price features like price gaps and candlestick patterns.
This is why I recommend using the Heiken-Ashi candlestick chart to identify note-worthy price action before switching to the standard candlestick chart for further analysis.
For instance, when the market is in a clear trend, there is no need to over-analyze. But when the market starts to stall, it’s time to dive in and assess if the market is merely taking a break or preparing for a reversal.
In a nutshell, Heiken-Ashi candlestick charts excel at telling us when to pay attention.
For candlestick traders, the Heiken-Ashi chart is a simple yet powerful addition to their trading arsenal.
Heiken-Ashi candlesticks are great because:
- They point out key trading zones for further candlestick analysis, saving you time and increasing your focus.
- They help to cut your anxiety as you let profits run.
- They do not need any user inputs—no need to tinker with different lookback periods to find the ideal moving average.
Finally, if you’re interested in a well-defined pullback strategy using the Heiken-Ashi candlestick chart, check out this tutorial.
Read: Chart Types without a Time Base
The article was first published on 12 January 2014 and updated on 17 December 2020.