Trading with Kings, Truth, and Bollinger Bands
By Galen Woods ‐ 4 min read
Learn how we combine this royal and moral trading approach with Bollinger Bands to profit from secular trends.
If you skim through Elaine Knuth’s Trading Between the Lines: Pattern Recognition and Visualization of Markets, you might mistake it for a book on archaeology and meteorology, with a dose of mythology. On a closer look, it is a colorful description of trading methods.
The Valley of the Kings and Place of Truth are Egyptian necropolises. Ancient Egyptians have already given the world the magnificent pyramids.
What insights do they offer for market traders?
Elaine Knuth uses the Valley of the Kings to describe the market when it rests and regenerates to continue a trend. It is visible from charts of higher time-frames. Place of Truth refers to the lower time-frame chart of the Valley of the Kings. According to her, the detailed price action usually shows wide range congestion before a strong break-out that resumes the trend.
Valley of the Kings and Place of Truth are concepts that describe a market state, and are not direct trading methods. To trade with it, we need the help of another trading tool.
Congestion followed by a strong break-out. Which trading indicator works well in tracking congestion and finding break-outs?
My answer is Bollinger Bands.
Study: How to Trade with Bollinger Bands
Trading Rules - Kings, Truth, Bollinger Bands
Long Trading Strategy
- 40-period EMA is above 200-period EMA on the higher time-frame
- Price falls into the zone between the two EMAs (Valley of the Kings)
- Buy when price closes above the upper Bollinger Band (20, 2) for two consecutive bars on the lower time-frame (Place of Truth)
Short Trading Strategy
- 40-period EMA is below 200-period EMA on the higher time-frame
- Price rises into the zone between the two EMAs (Valley of the Kings)
- Buy when price closes below the lower Bollinger Band (20, 2) for two consecutive bars on the lower time-frame (Place of Truth)
Kings, Truth, Bollinger Bands Trading Examples
Winning Trade - Bull Trend
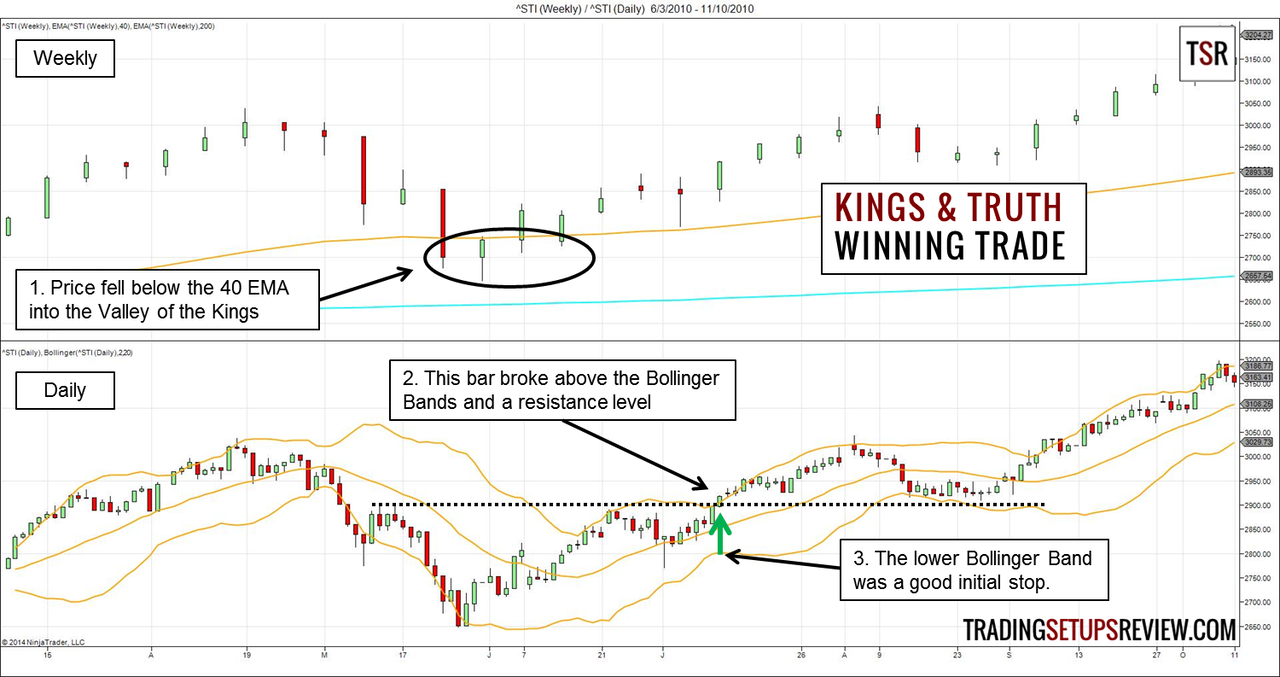
We applied this royal method on Singapore’s Straits Times Index. The top panel shows the weekly chart with the two EMAs to define the Valley of the Kings. The bottom panel shows the daily chart with Bollinger Bands.
- Price fell into the zone between the two EMAs into the Valley of the Kings. So we turned our attention to the lower time-frame.
- On the daily chart, price went sideways between the upper Bollinger Band and the moving average. Eventually, price broke out above the Bollinger Bands and a double-top resistance.
- The lower Bollinger Band provided a safe level for an initial stop-loss order.
Losing Trade - Bear Trend
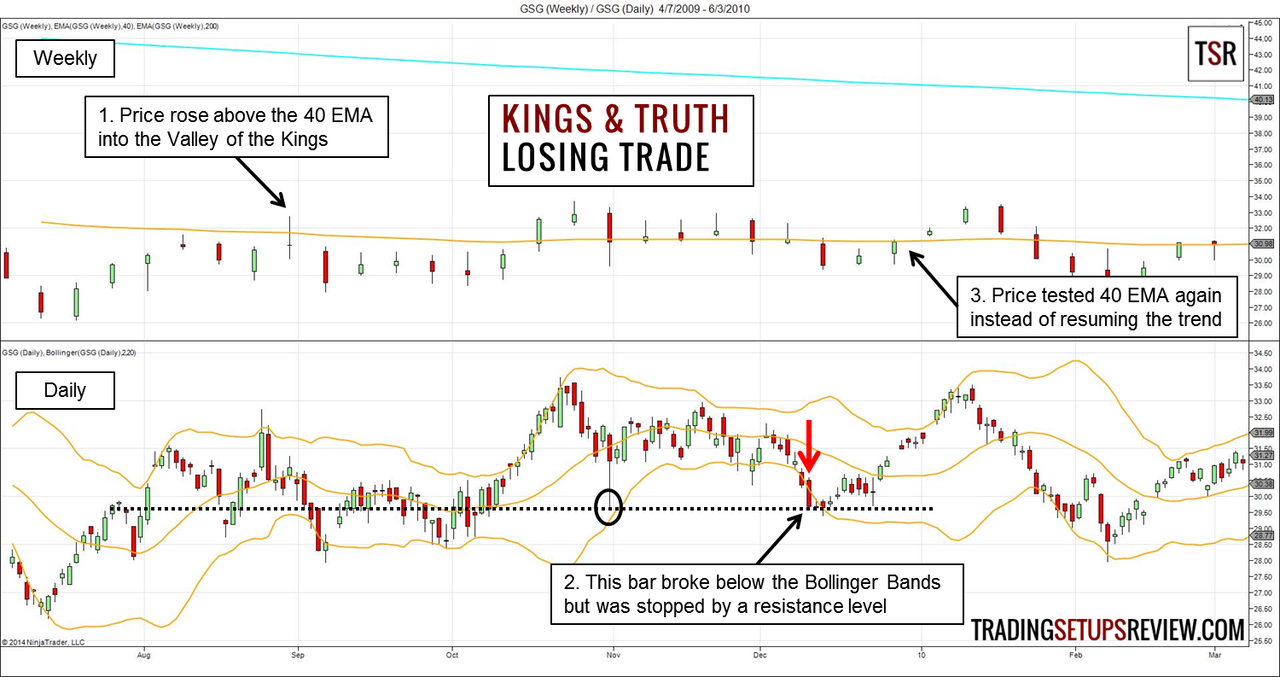
This chart shows the two time-frames of iShares GSCI Commodity-Indexed Trust.
- Price rose up above the 40 EMA into the Valley of the Kings in the weekly chart.
- In the daily chart, price broke below the Bollinger Bands and gave us a short signal. However, the downwards thrust did not punch through the resistance level from an earlier swing low.
- Right after our entry, prices went straight up to tag the upper Bollinger Band. It was the beginning of a prolonged sideways market for this commodity ETF.
Review - Trading With Kings, Truth, And Bollinger Bands
The Valley of the Kings and Place of Truth are memorable names for a multiple time-frame trading approach. They drive home the concept of trend regeneration and offer a reliable way to take part in a long-term trend.
However, the price action within the Valley of the Kings is normally erratic. Wait for a decisive break-out before entering the market. Our trade examples also showed how support and resistance levels can help to pinpoint better break-outs.
When trading in the Valley of the Kings, remember that “later is always better than earlier”. If not, you might get trapped in the many false break-outs. This is also why our trading rules ask for two closes beyond the Bollinger Bands.
With price pattern entries, we can use a pattern stop at the other end of the setup bar. However, in this case, it is wiser to place a wider stop. Remember that we are trying to profit from a long-term trend. Make the trade worthwhile by letting profits run.
Elaine Knuth applied this trading method as a long only strategy. I believe this is because she focused on secular trends that tend to move up. In spite of this, I find the concepts useful in bear trends as well.
Instead of Bollinger Bands, breakaway gaps and classic chart patterns on the lower time-frame chart are also great for finding trade entries.
Read: Q&A regarding the Valley of the Kings with Elaine Knuth (expand the product description at the top of the page to see)
Image credit: Peter J. Bubenik [CC BY-SA 2.0], via Wikimedia Commons
.jpg#file)