Price Action Trading Strategies Beyond Price Patterns
By Galen Woods ‐ 8 min read
Price action trading strategies are not merely price patterns like Pin Bars or Inside Bars. Learn what really goes into a high probability strategy.
Most price action trading strategies revolve around price patterns like Pin Bar, Inside Bar, and Engulfing Pattern. As a result, many traders equate price action trading strategies with price patterns. But the truth is that price patterns form only a part of these trading strategies.
Let’s take the Pin Bar pattern as an example.
A Pin Bar trading strategy must define the right market conditions for the pattern, the entry rules, and the exit method. Buying and selling every Pin Bar pattern without a detailed action plan is a recipe for disaster.
The key message is that price action trading strategies go beyond price patterns.
Minimally, a price action strategy must answer the following questions:
- How do we determine the market bias?
- What does our trading setup look like? In other words, how and when do we enter the market?
- How do we exit the trade?
This article will explore each question to determine what makes price action strategies effective.
Market Bias - Price Action Context
Market bias refers to the market’s tendency to move in a particular direction, either up or down. You can also call it the market trend or price action context.
The market bias is what gives us our edge. It has a strong influence on the success of our trades, far more than any price pattern in isolation.
Market Bias Examples
To illustrate this point, we will look at how different patterns perform within a given market context.
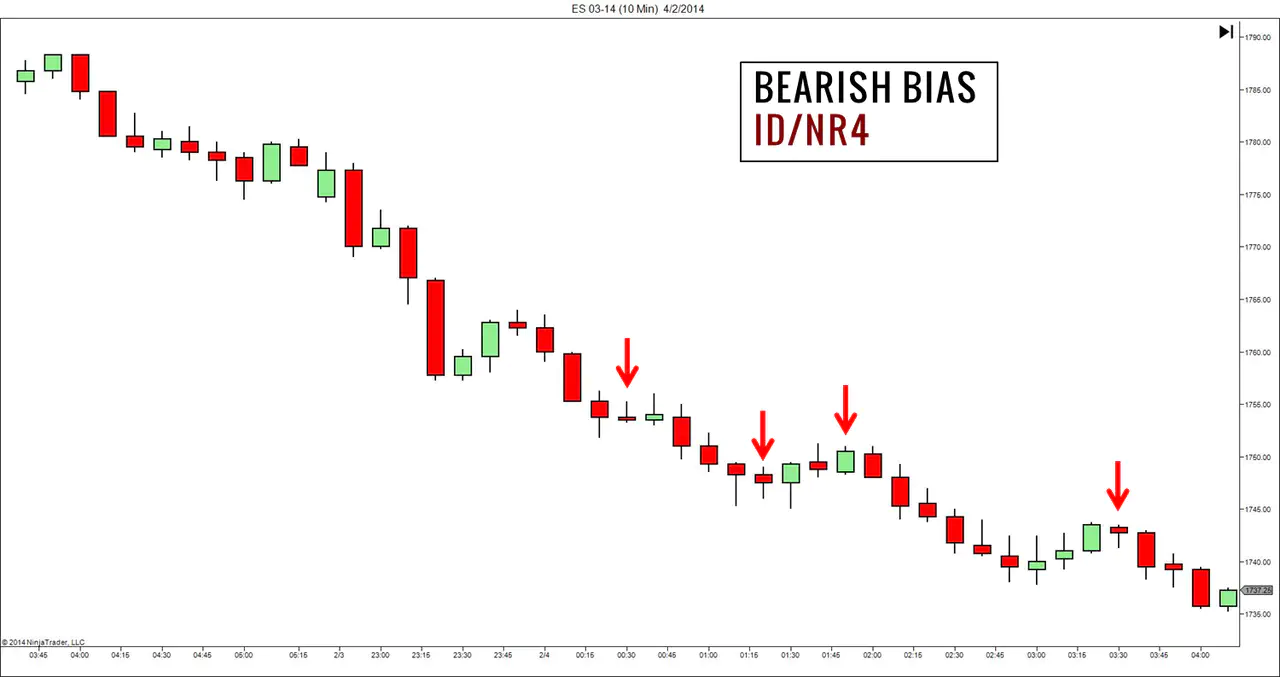
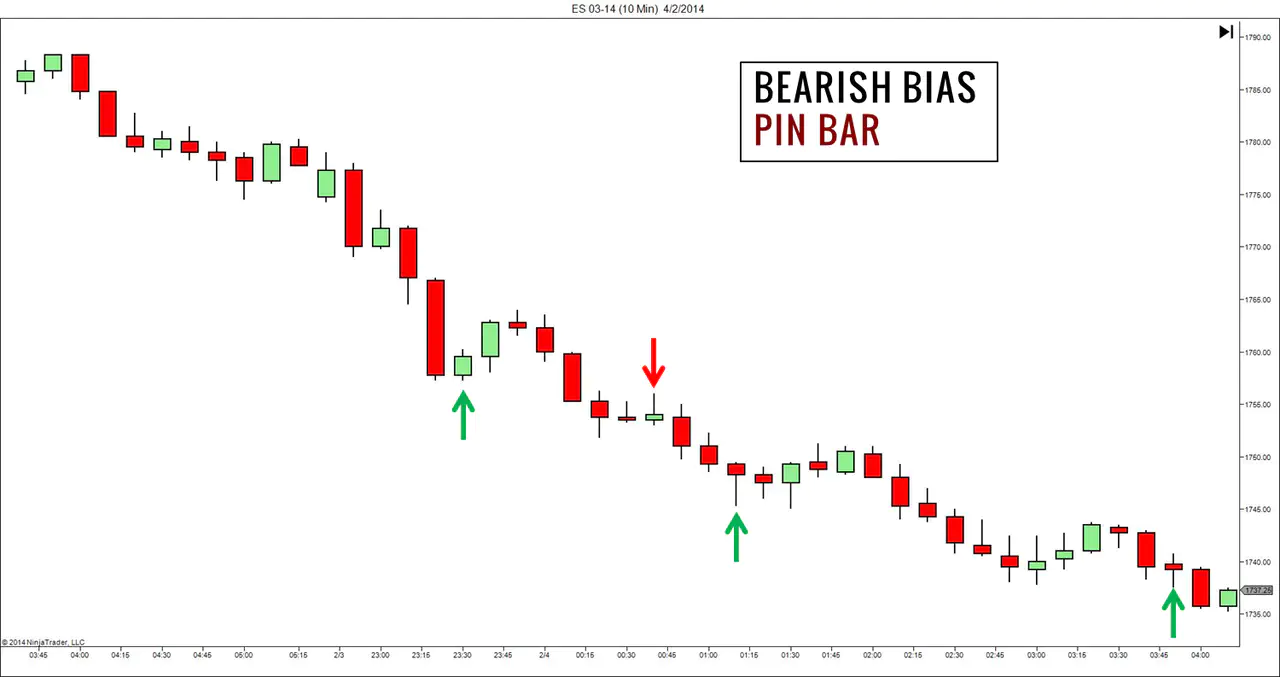
The three charts below show the same set of price bars.
We marked out the ID/NR4 patterns on the ES chart below.
We also observed how Pin Bars performed in this market.
This last chart marks out the two-bar reversals.
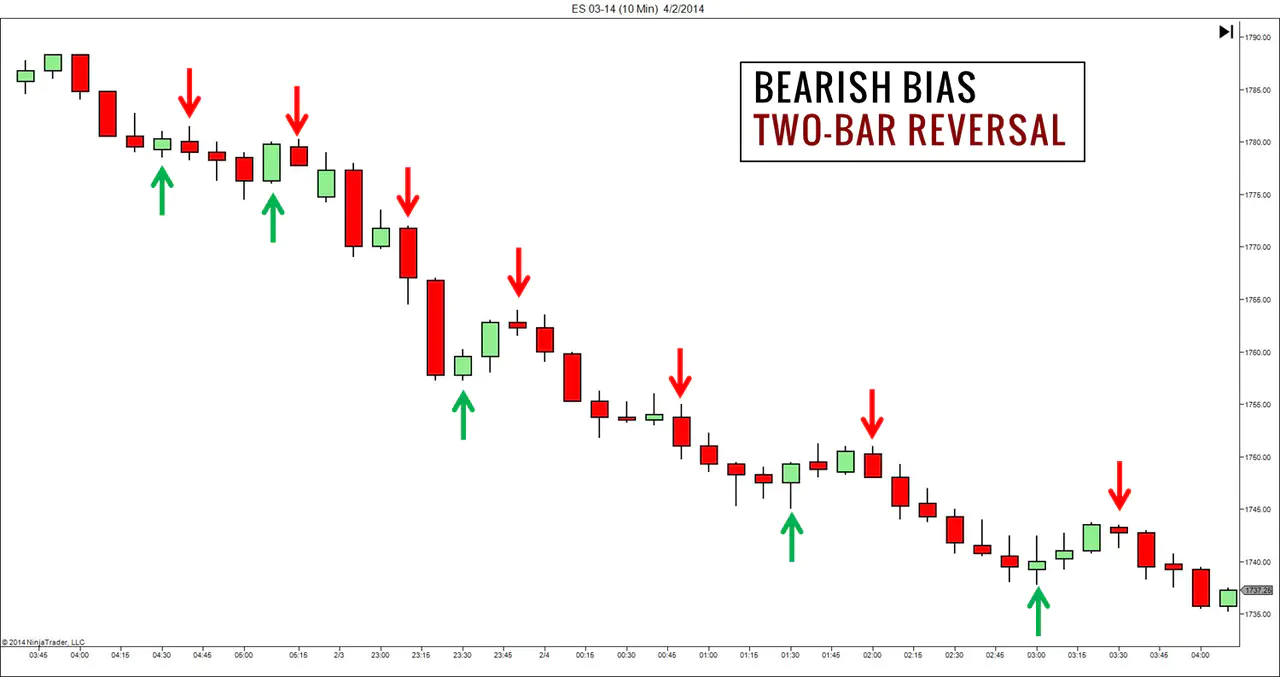
Most of the bearish signals did well for all three patterns, and most of the bullish patterns failed.
The last chart (showing the two-bar reversals) is hugely telling.
- More selective traders would look out for two-bar reversals with strong bars in both directions or for the second bar to completely reverse the first bar.
- However, for our example, we did not impose any additional criteria to “enhance the pattern.”
We simply marked all two-bar combinations with opposing directions (i.e., a bullish bar followed by a bearish bar, or vice versa). As it turned out, this simple pattern did exceptionally well, as long as we kept to a bearish bias.
The merit does not lie with the pattern but with the bearish market bias.
The point here is that once we get the market bias right, almost any pattern can produce results. Of course, there might be whipsaws, but they are not fatal as long as we have a sensible method to control our trade risk.
With this in mind, it makes sense to devote our time to figure out the market bias instead of searching frantically for price patterns.
However, this is easier said than done.
We selected the bullish examples above by looking back in time - anyone can do that.
The real challenge is in evaluating the market bias in real-time.
Market Bias Tools and Concepts
In price action trading strategies, you can use several simple but effective tools to decipher the market bias.
- Market Structure
- Trend Lines
- Support and Resistance
- Volume
- Multiple Time-frames
#1: Market Structure
The market never moves in a straight line. Instead, it moves in wave-like price swings, creating swing highs and lows.

Most price action trading strategies are sensitive to the market structure built by these swing pivot points.
- Higher highs and higher lows point up. (As shown above)
- Lower highs and lower lows point down.
Read: Trading Engulfing Candlestick Pattern With Market Structure
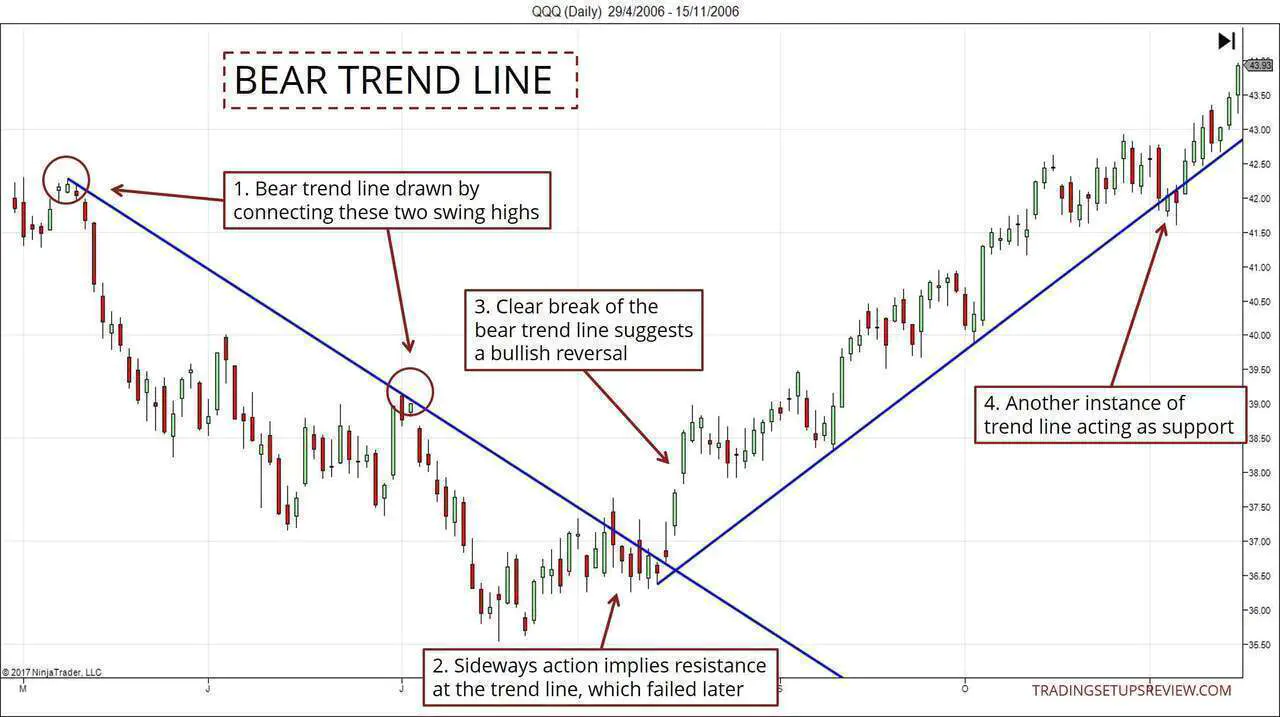
#2: Trend Lines
Upwards sloping trend lines track bullish markets, and downwards sloping trend lines follow bearish markets.
While false breaks offer pullback setups, a decisive trend line break signals the beginning of a new opposing trend.
For another example that uses a trend line to define market bias, refer to the last section of Template for a Simple Day Trading Strategy.
#3: Support And Resistance Areas
In a bullish market, support levels are likely to hold up.
In a bearish market, resistance areas tend to keep the market down.
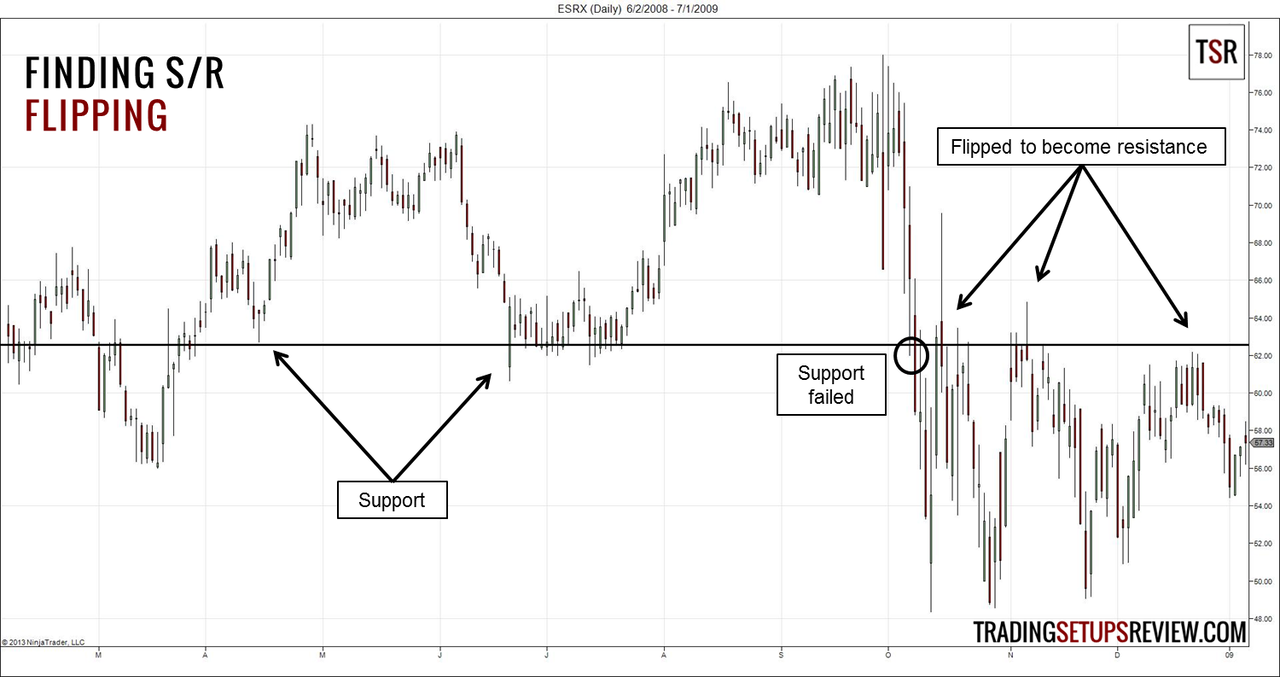
By paying attention to how the market reacts to significant support and resistance areas, we can get a glimpse at the actual bias of the market.
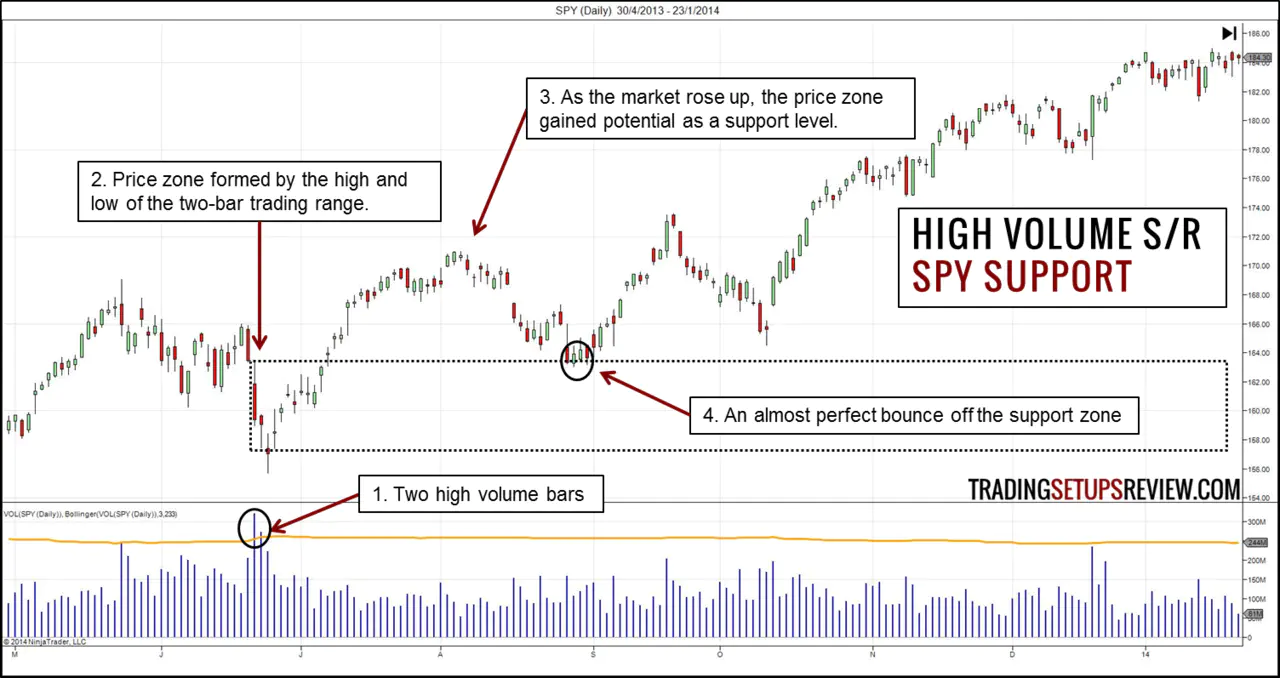
#4: Volume
Many price action trading strategies include volume analysis.
One of the best uses of volume is paying attention to volume spikes. You can learn more about this concept in this article.
The chart below shows how volume spikes help to define an effective support area.
#5: Multiple Time-Frames
Another powerful method to work out the market bias involves applying the techniques above on higher time frames.
For instance, you can analyze the trend line on the daily chart to figure out the market bias. Then, adhere to that bias as you find setups within the intraday session.
The same approach applies to other tools like the market structure and support and resistance.
Integrate For Best Results
When implementing price action trading strategies, integrate these tools to determine which direction the market is more likely to head in. This is the first step in any price action trading approach.
An integrative approach makes sense as these tools are not mutually exclusive.
For instance, a trend line is a form of support and resistance; and analyzing the market structure often leads to drawing reliable trend lines.
The importance of market bias also explains the rise of global macro trading and trend following strategies. The former uses fundamental data, and the latter employs technical methods. But both approaches focus on aligning themselves with the market bias while putting less emphasis on the exact timing of their entries.
Price Action Trading Setup
A trading setup is a specific set of market circumstances we want to see before considering a trade.
The starting point is usually a price pattern within price action trading strategies.
Examples of short-term price patterns include an inside bar, reversal bar, or candlestick pattern like Engulfing or Morning Star. Some price action trading setups focus on longer-term chart patterns like Head and Shoulders and Double Top.
But didn’t we just state that the market bias provides us with the trading edge? So then, why can’t we just figure out the market bias and jump right into the market?
Why do we need a trading setup?
In theory, we can simply enter a trading position once we are confident of the market bias. Once we change our bias, we exit and maybe reverse our position.
However, this way of trading requires deep pockets.
This is because the adverse price change between the time we enter, and the time we realize that our market bias has changed, can be huge.
Since retail traders do not have deep pockets, we need to control our risk by risking little pockets of money each time.
This leads us to the purpose of a trading setup - risk control.
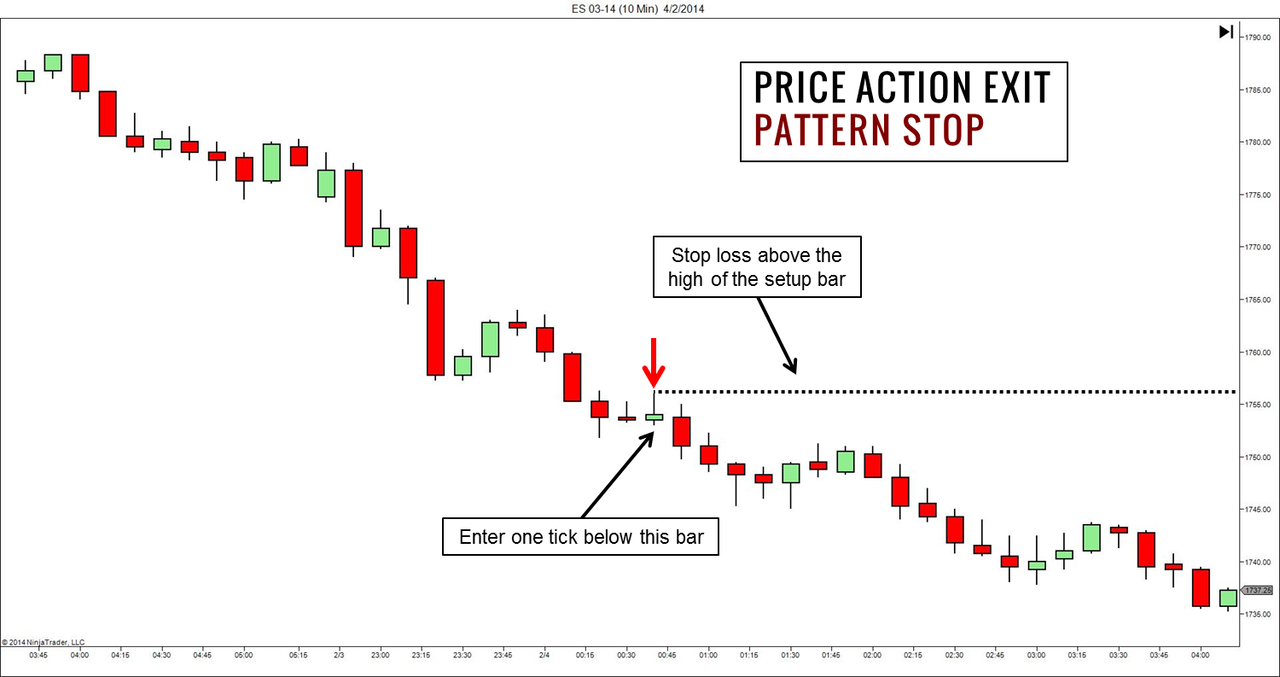
We can pinpoint a stop-loss point by timing our entries with a setup.
This is especially true for price action setups with a natural and logical pattern stop point. This point is usually the lowest point of a bullish pattern or the highest point of a bearish pattern.
Pattern Stop
The chart below shows the natural stop-loss level of a bearish Pin Bar pattern.
(Too many price patterns to learn? Start with our Guide to Reading Price Action.)
Trade Exit Plan
There are several ways to exit a trade. But there are always two scenarios to plan for: exiting when you’re wrong and exiting when you are right.
As discussed above, when the market goes against us, our stop-loss depends on our entry pattern.
When the market flows in our anticipated direction, we need to have sensible targets.
Here are two standard price-based methods:
- Support and Resistance
- Measured Move
Support/Resistance
Support and resistance levels provide logical points for exiting.
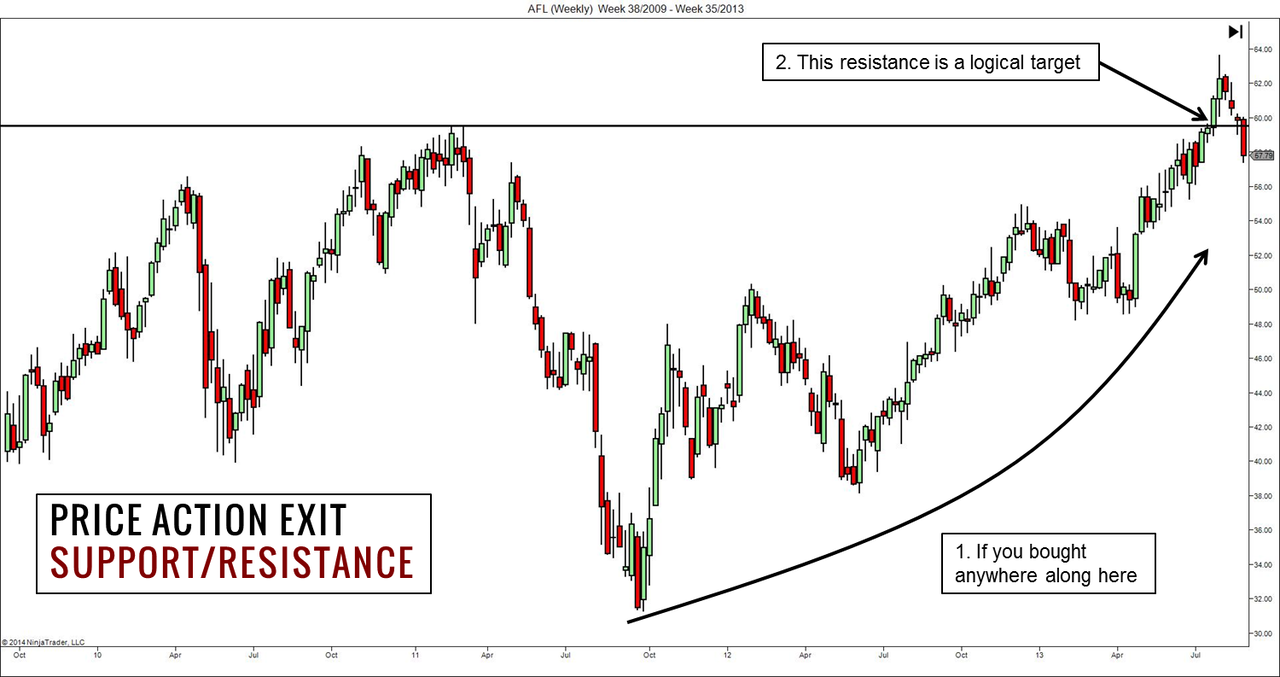
- For a long position, the nearest resistance level is the highest probability target.
- For a short position, the closest support level is the highest probability target.
If we aim for levels that are further away from the market, we need to accept a lower chance of the market hitting our target. On top of that, expect some pullbacks along the way.
As traders, this is the type of trade-off we need to manage to eke out positive expectancy.
Measured Move
Support and resistance are projected from historical price features.
If the market is breaking new ground, moving into price ranges that it has not been to recently, then we might not find practical support and resistance levels.
In such cases, the measured move presents a valuable concept for projecting targets.
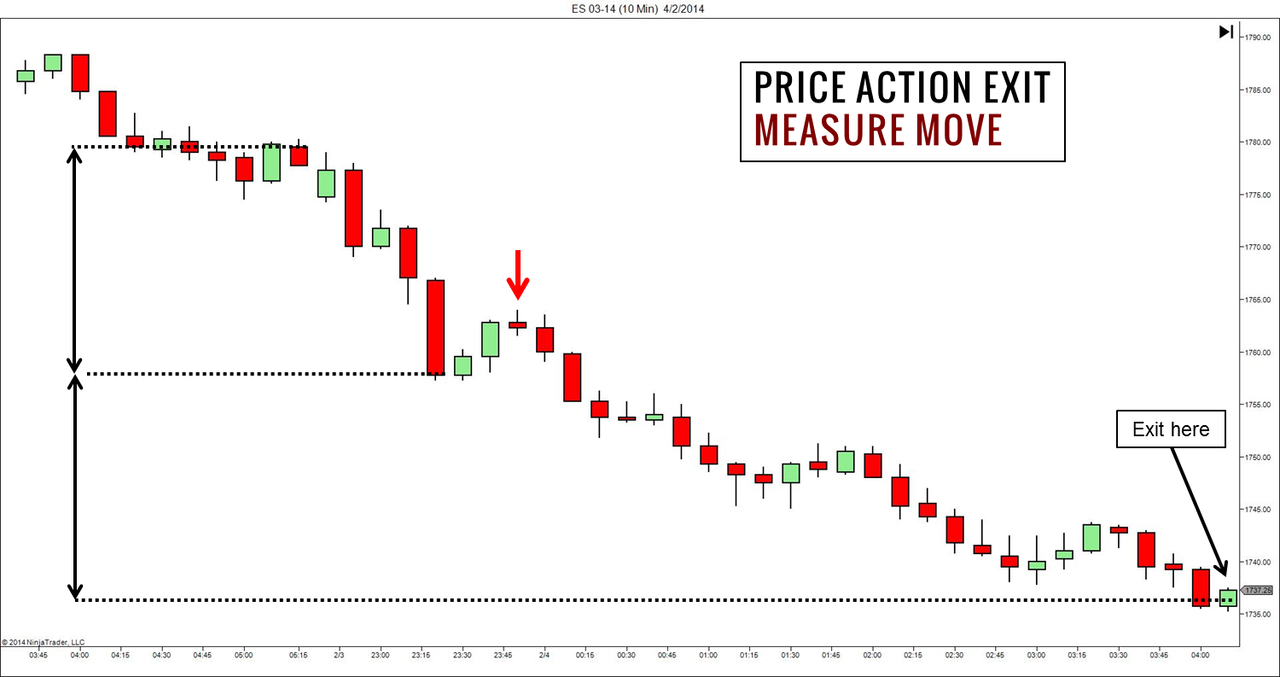
The measured move takes the length of a previous impulse swing and projects it by the same amount.
It is a specific instance of Fibonacci extension using 100% for the projection. Using a smaller percentage gives more conservative targets.
Base your projection on a solid and clear impulse wave for best results.
For more targeting approaches, refer to this comprehensive guide on taking profits.
Creating Your Price Action Trading Strategies
Ultimately, trading boils down to finding a method that suits your skills and temperament.
Hence, instead of blindly following price action trading strategies of other traders, be discriminating. Learn from them what makes sense to you.
- First, focus on picking methods and knowledge that answer the three questions revolving around price action trading strategies.
- Then, combine them to create complete price action strategies that work only for you.
- Finally, proceed slowly and manage your risks.
Remember that price action trading strategies go way beyond just price patterns.
The article was first published on 27 March 2014 and updated on 26 April 2022.