How To Trade With Fibonacci Numbers
By Galen Woods ‐ 6 min read
Learn how to trade with Fibonacci numbers and master ways to use the magic of Fibonacci numbers in your trading strategy to improve trading results.
What are Fibonacci numbers?
Leonardo Fibonacci introduced the Fibonacci numbers to Western mathematics in a 13th century book.
0, 1, 1, 2, 3, 5, 8, 13, 34, 55, 89, 144, …
Each number is the sum of the two numbers preceding it. Fibonacci numbers have unique properties and a special connection to the Golden Ratio.
Now, I will hand over to mathematician Arthur Benjamin, who is far more qualified to explain the magic of Fibonacci numbers.
Fibonacci in Trading
The magic of Fibonacci numbers is found in nature and biology. Designers, architects, and even computer scientists apply Fibonacci sequence in their work.
It is not surprising that, somewhere down the road, traders decided to give Fibonacci a chance. However, instead of using the Fibonacci numbers directly, traders focused on the Fibonacci ratios.
34/55 = 0.618 (Divide by next number)
34/89 = 0.382 (Divide by the next next number)
34/144 = 0.236 (Divide by the next next next number)
From these ratios, we got a whole host of Fibonacci trading techniques. These techniques have grown in application and complexity. And it is definitely possible to build a trading strategy completely around Fibonacci trading techniques.
Fibonacci Trading Techniques
There are several Fibonacci trading techniques. However, all Fibonacci trading techniques:
- Anticipate price action, and not react to it;
- Attempt to find support/resistance areas;
- Are calculated based on a selected market swing.
The predictive nature of Fibonacci trading tools draws traders who are sick of lagging indicators.
For clarity, we applied the different Fibonacci tools below on the same bull swing from a weekly chart of SPY.
Fibonacci Retracements
This trading technique uses Fibonacci ratios to project price levels where we expect retracements to end.
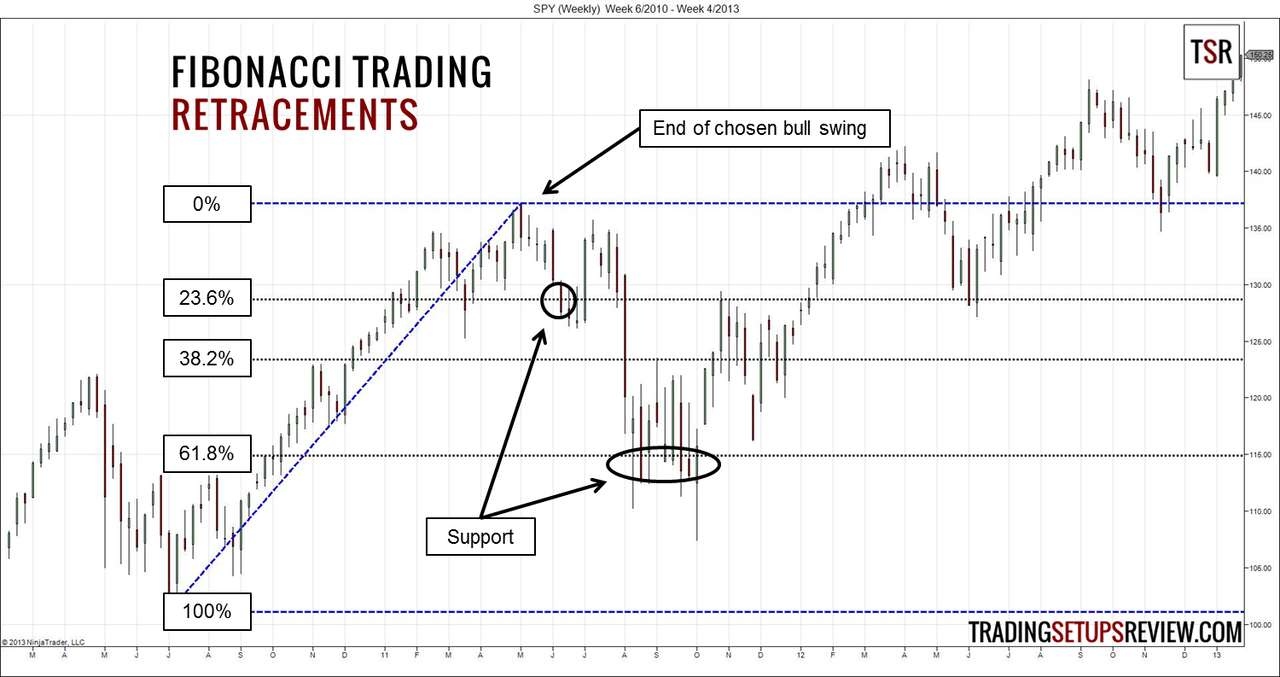
Choose a market swing so that you can plot the retracement levels. The chosen market swing will define the range as shown in blue. Then, we apply the Fibonacci ratios within that range as shown by the black dotted lines.
In this example, price found some support at the 23.6% level but punched right through the 38.2% level. However, the golden ratio level (61.8%) provided solid support and stopped the retracement.
Fibonacci Fans
From Fibonacci retracements, we are able to draw Fibonacci fans which are a series of trend lines starting from the same point.
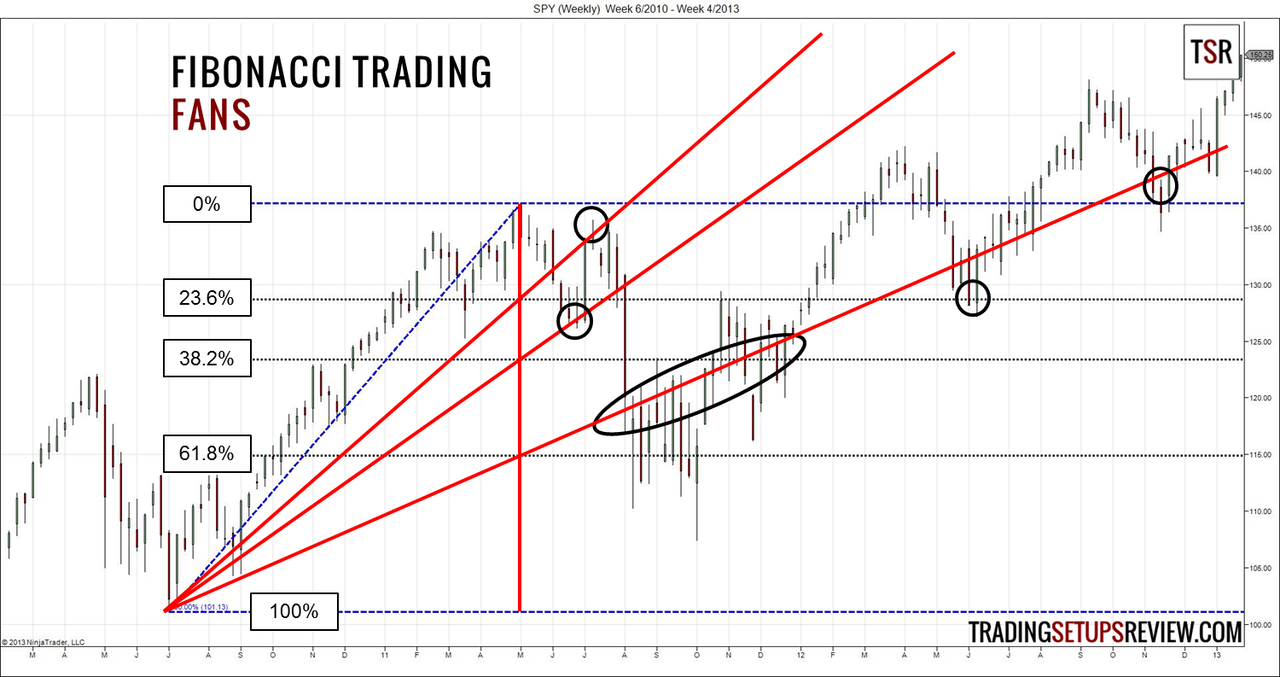
This is the same chart as above. We added the Fibonacci fans in red.
Draw a vertical line down from the peak of the chosen swing. Then, draw a trend line that passes through the lowest point of the swing, and the point where the vertical line and a retracement level intersect. There are three retracement levels, so there are three trend lines.
For down swings, apply the same logic.
These trend lines act as support and resistance as circled in black.
Fibonacci Extensions
This trading technique is similar Fibonacci retracement. However, instead of projecting retracements within the range of the swing, it projects extensions beyond the swing and is useful for planning price targets.
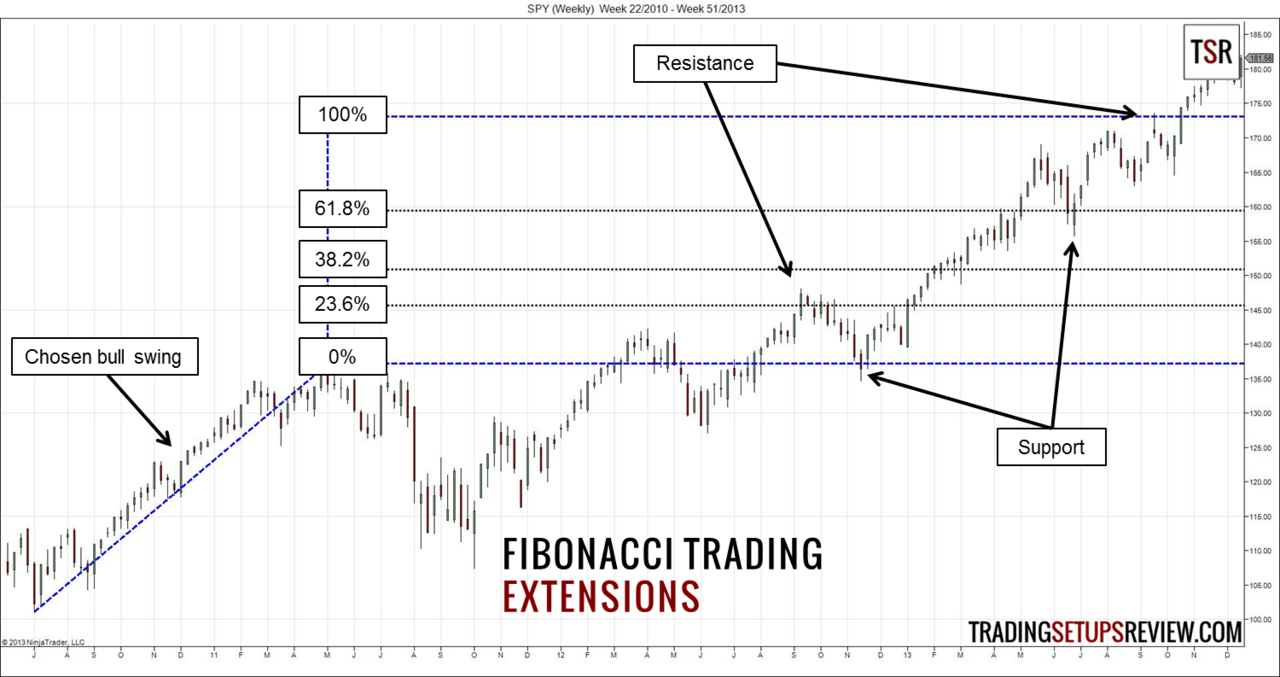
We used the same chart as earlier examples but included more price action to the right of the chart. The black extension lines are possible resistance levels.
The 23.6% level was a decent conservative target. There was also a minor resistance at the 100% extension level. Some of the extension levels acted as support which demonstrates the flipping of resistance to support.
Fibonacci Circles & Arcs
Apparently, straight lines are not enough. Let’s bring market geometry to another level. Come on, bring the circles in.
These circles add a time element to Fibonacci trading. The curves are reminiscent of parabolic chart patterns and the Parabolic SAR trading indicator, which come from the concept of accelerating prices.
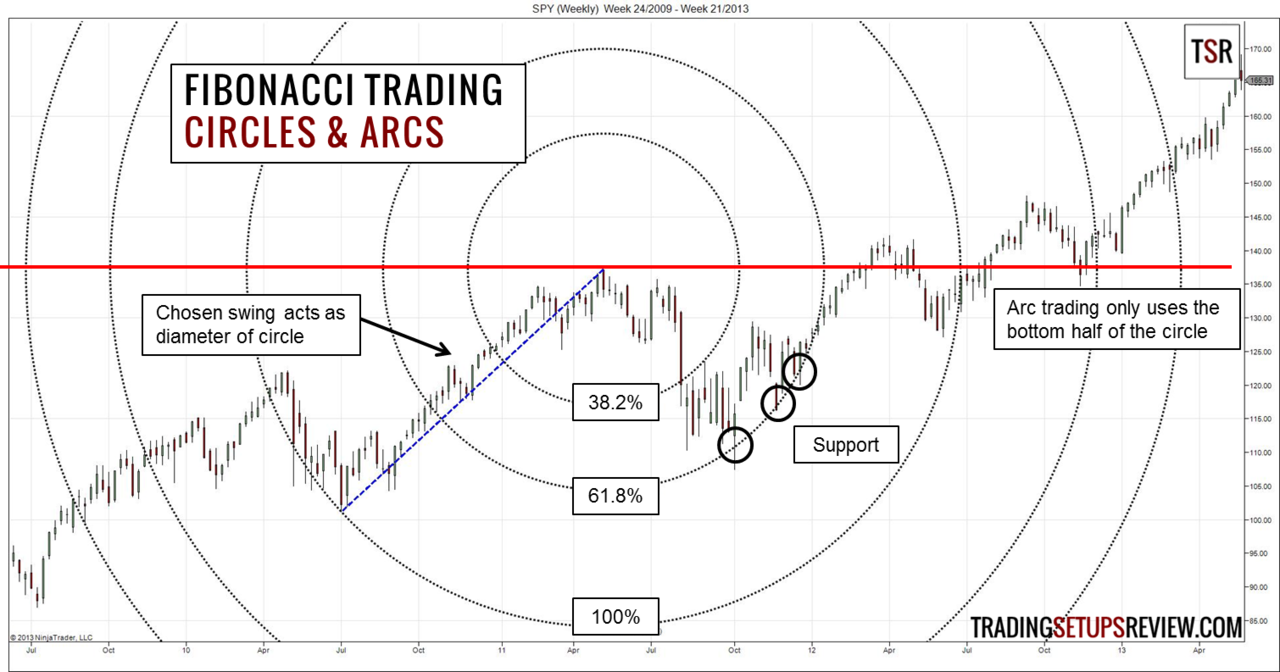
The top of the swing acts as the center of the circle. Draw a circle using the swing as the diameter and you get the 100% circle level. Then, use Fibonacci ratios to calculate different diameters for the other circle levels.
Circle trading uses entire circles as potential support and resistance level while arc trading uses only the bottom half of the circles (below the red line). As you can see from the example above, the 61.8% circle level was a great support for price. The other levels are less impressive.
Fibonacci Time Extensions
Apply Fibonacci extensions to the horizontal time axis and you get Fibonacci time extensions. The extension lines mark out when we can expect the market to turn.
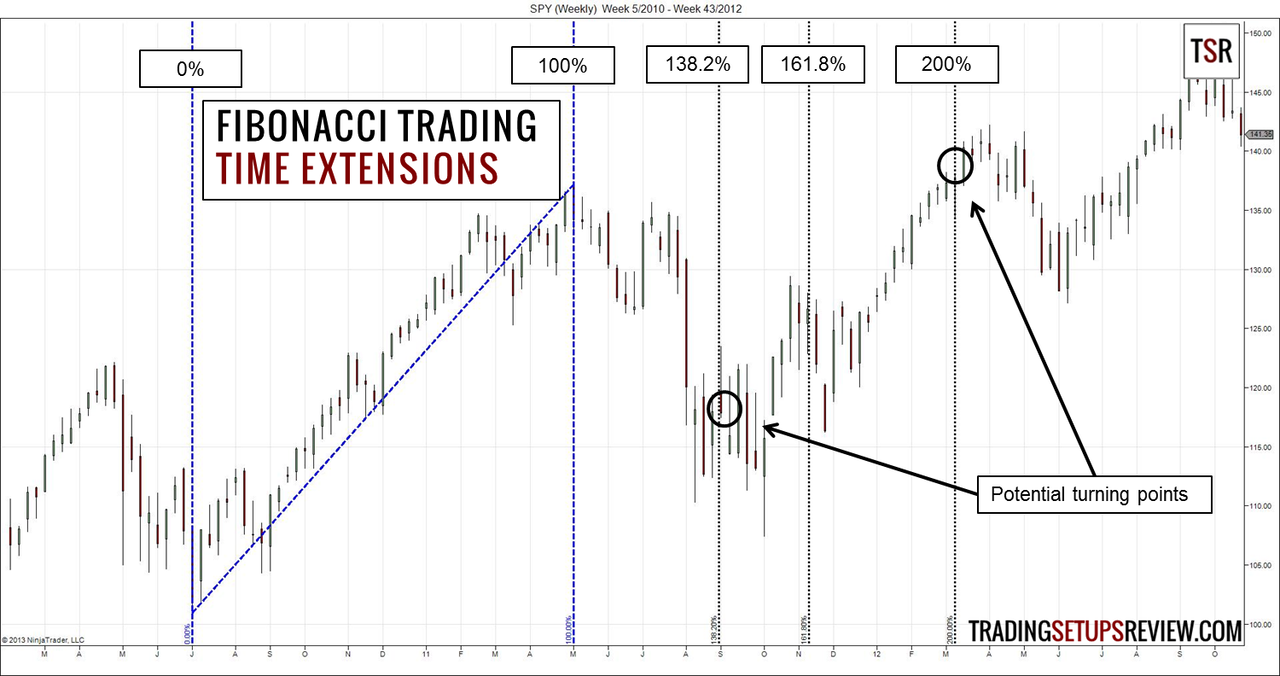
In this example, the 138.2% and 200% extensions caught the turning points.
Since these are time extensions, do not use this trading technique on charts without a time base.
Another Fibonacci trading technique that uses time is the Fibonacci time zones. It projects time extensions using Fibonacci numbers instead of Fibonacci ratios. From the chosen point, it extends 1 bar to the right followed by 2 bars, then 3 bars. Then, another 5 bars followed by 8 bars and so on. You get the idea.
How to Really Trade with Fibonacci Numbers
Fibonacci numbers are near magical in nature and biology, and are wonderful in design and arts. We might find part of that magic and wonder in financial markets driven by human psychology.
At least some academics agree with the power of Fibonacci numbers in financial markets.
(Read: A computational exploration of the efficacy of Fibonacci Sequences in Technical analysis and trading & The Applications Of The Fibonacci Sequence And Elliott Wave Theory In Predicting The Security Price Movements: A Survey)
However, Fibonacci trading techniques, like any other trading method, are fallible. Do not attach mystical power to it.
Regardless of whether Fibonacci numbers are magical, they offer a useful framework for analyzing price action. For example, 38.2% retracement is a shallow pullback and 61.8% is a deep pullback. Instead of blindly classifying pullbacks, we have a framework to help us assess pullbacks.
The Fibonacci trader needs to exercise discretion in two main aspects.
First, we need to choose the swing that serves as the basis of our Fibonacci projections. We need to decide what is a market swing and adjust the selected swing as price action unfolds. A rule of thumb is to focus on major and clear market swings. Do not clutter your charts with too many lines and curves. (A common trap for Fibonacci traders.)
Second, we must decide if the projections are effective support/resistance. As shown in the examples above, not all projected support/resistance levels work well. Looking out for reversal patterns at projected Fibonacci levels is an effective trading method.
You can also consider other ratios in your projection. Some popular ratios we did not include in our examples are 50% and 78.6%. 50% is not a Fibonacci ratio but it works well. I find the zone between 50% and 61.8% useful for Fibonacci retracements. As for 78.6%, it is the square root of 61.8%.

.