Your First Guide To Trading With The Volume-Weighted Average Price (VWAP)
By Galen Woods ‐ 5 min read
The Volume-Weighted Average Price (VWAP) is a unique intraday trading tool for assessing the market bias. Learn how to use it with our beginner's guide.
There are dozens of trading indicators out there. But among them, there’re a few that stand out as exclusive intraday trading tools. And the volume-weighted average price (VWAP) is the best-known example.
This guide aims to introduce you to this nifty intraday trading tool.
What is the Volume-Weighted Average Price?
The VWAP is the average price of all transactions within a trading session. (Don’t confuse it with the VWMA.)
It is calculated cumulatively, accounting for the volume traded as the session progresses. For this reason, you do not need to choose a lookback period.
VWAP Formula
Total dollars amount transacted divided by The total shares or contracts traded for the day
Click here for a detailed VWAP calculation example.
Key Points You Should Know About The VWAP
- Based only on the price and volume data of the current session. (In contrast, typical moving averages include prices from the past session.)
- Used to measure trading efficiency for large institutional orders. For instance, you manage to execute a buy order at an average price below the end-of-day VWAP. Then, you’ve enjoyed a better than average price.
- More sensitive to price and volume changes at the beginning of the session. Becomes less responsive as the session progresses.
Due to this progressive lag, the VWAP might not be appropriate for timing market entries.
Then what is the VWAP good for?
It is a valuable tool that reduces market noise and illuminates price bias. This indicator incorporates both the price and volume of each session. Hence, it’s a handy benchmark for judging the market bias.
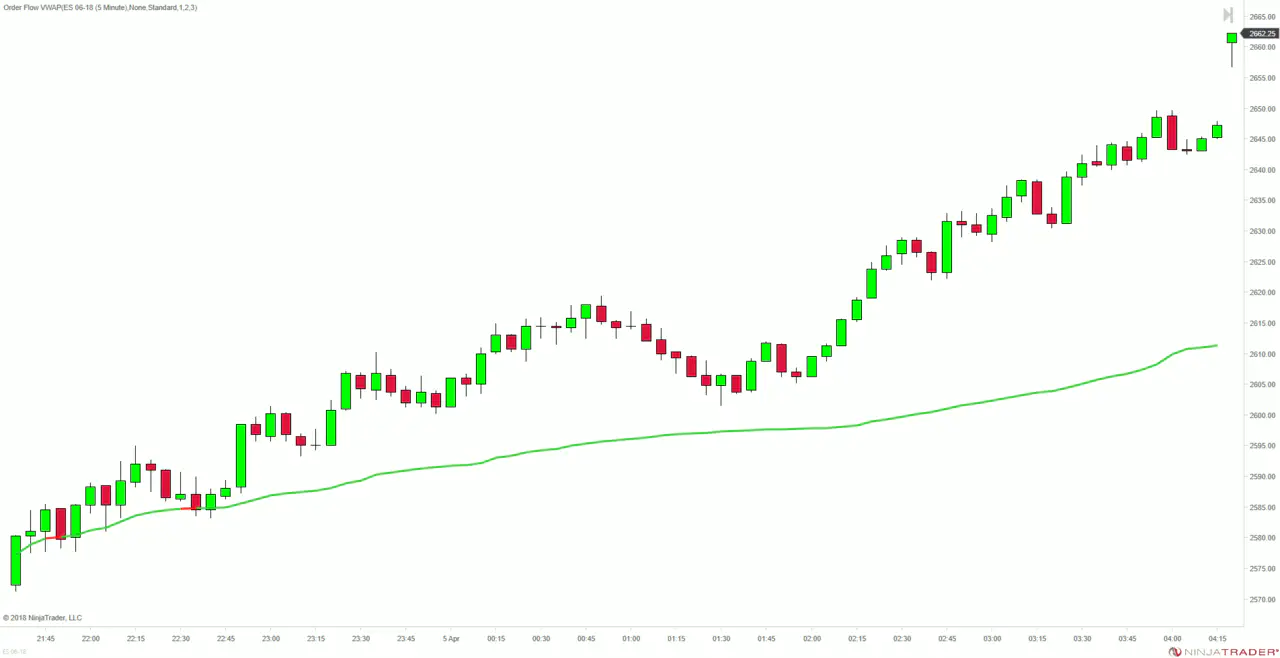
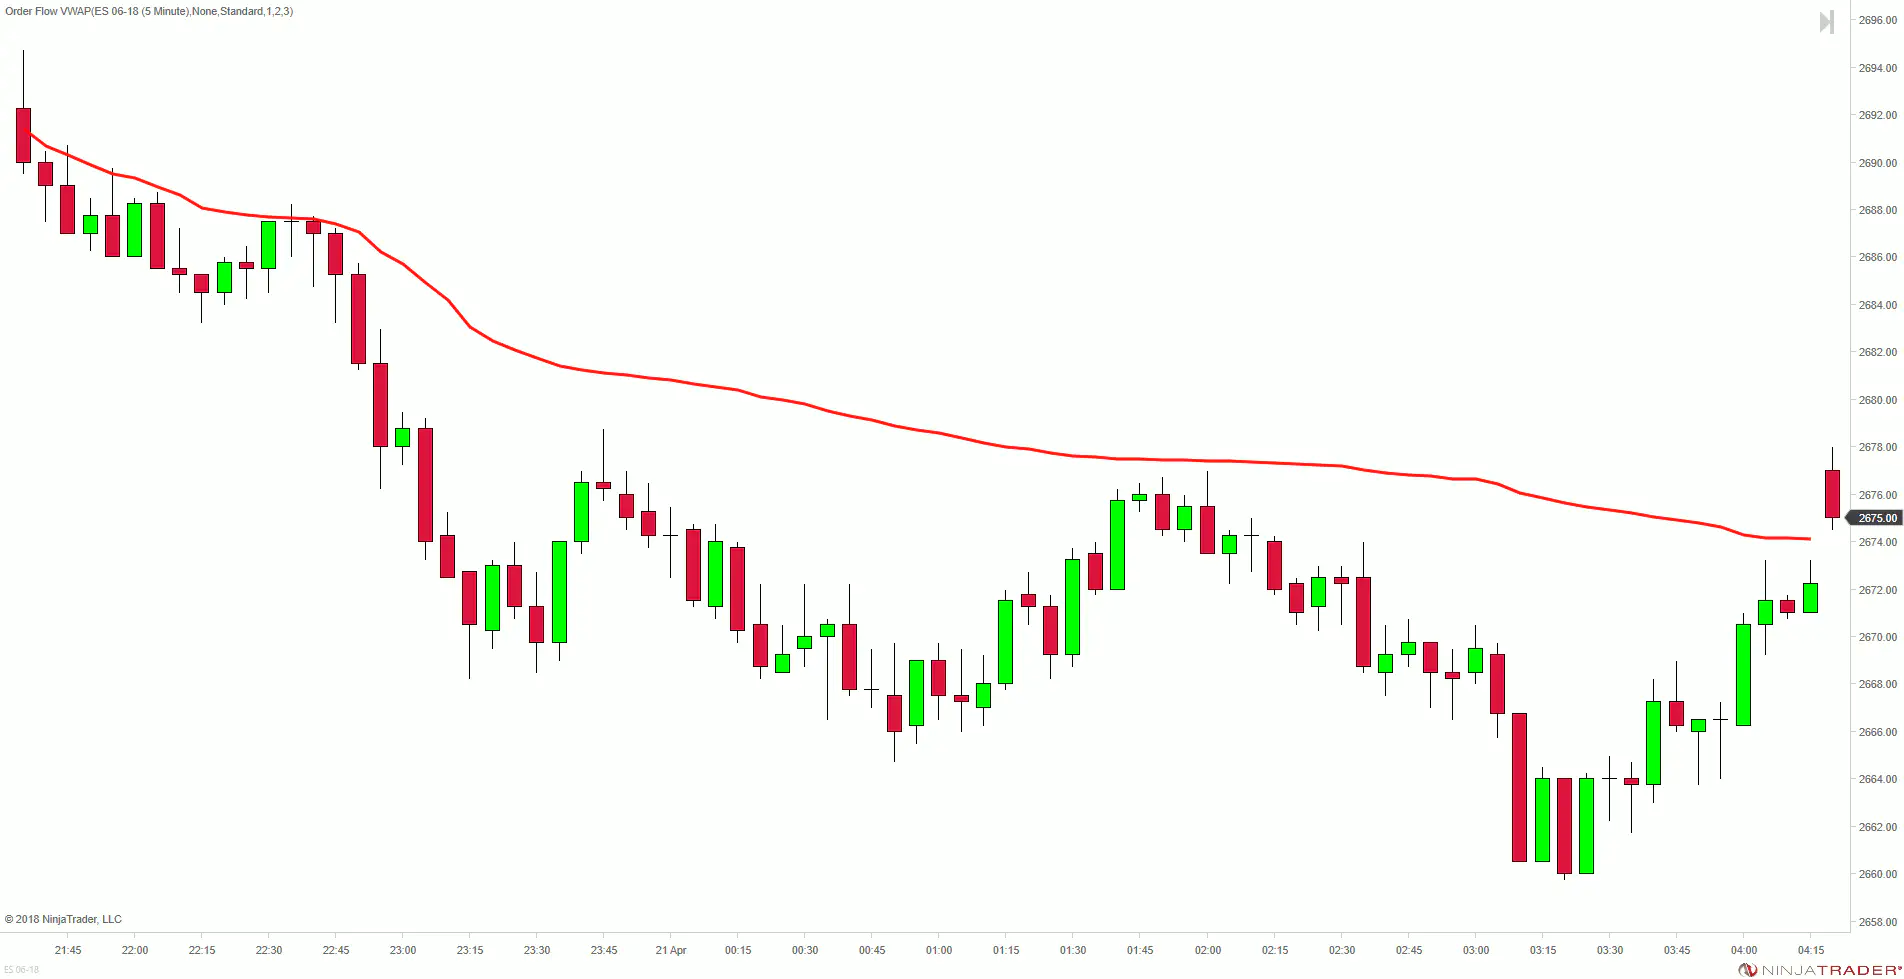
Take a look at the intraday charts below.
Trending Sessions
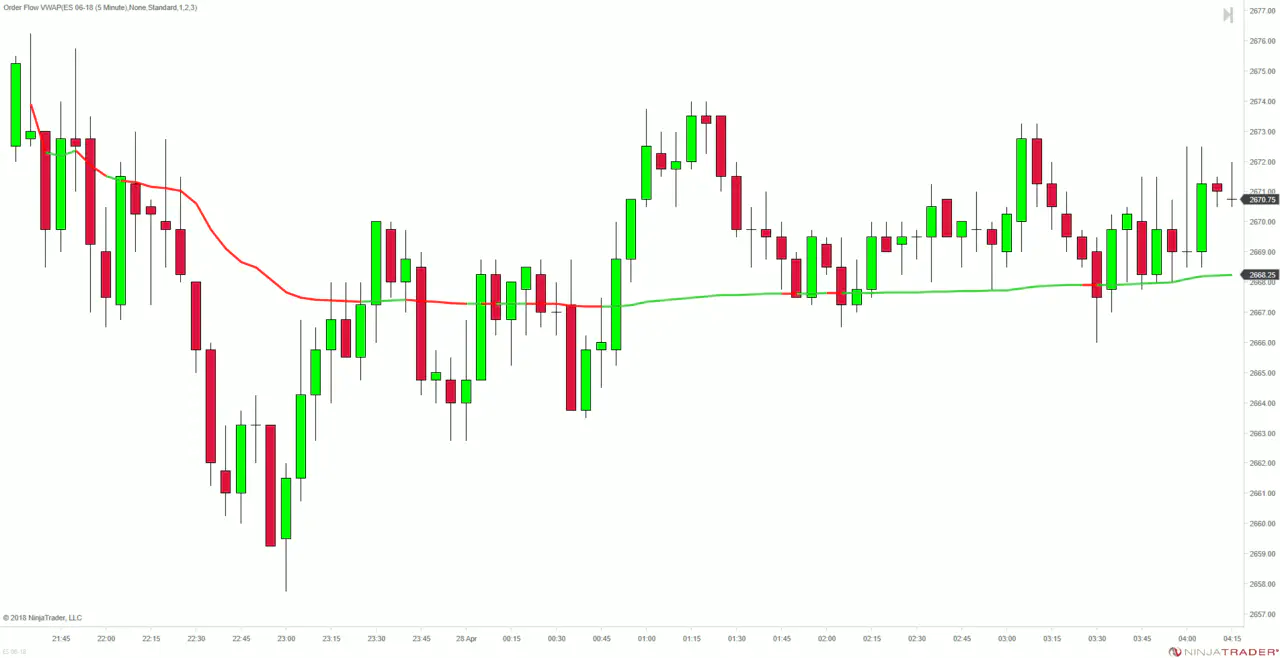
Ranging Sideways Session
Observations
- For bullish trend days, the market stays mostly above the VWAP.
- For bearish trend days, the market stays mostly below the VWAP.
- For ranging sessions, the market stays mostly around the VWAP which remains more or less flat.
These observations show that the VWAP has great potential for helping traders identify the market tide.
See it for yourself, whip up a 5-minute chart for any market and load the VWAP.
How To Use It To Determine The Market Trend
Here, you’ll learn a method that you can apply immediately to your intraday trading.
- Step 1: Look for a push away from the VWAP. (Tip: Look at thrusts made up of at least consecutive three bars that are not overlapping with the VWAP.)
- Step 2: Observe if that push enjoys follow-through or is rejected back to the VWAP level.
If the thrust away from the VWAP enjoys follow-through, assume a trending session. You can then consider momentum trades in the direction of the trend.
If the market rejects the price thrust back to the VWAP, assume a sideways session. Consider taking mean-reversion trades in this case.
Trending Session Chart Example
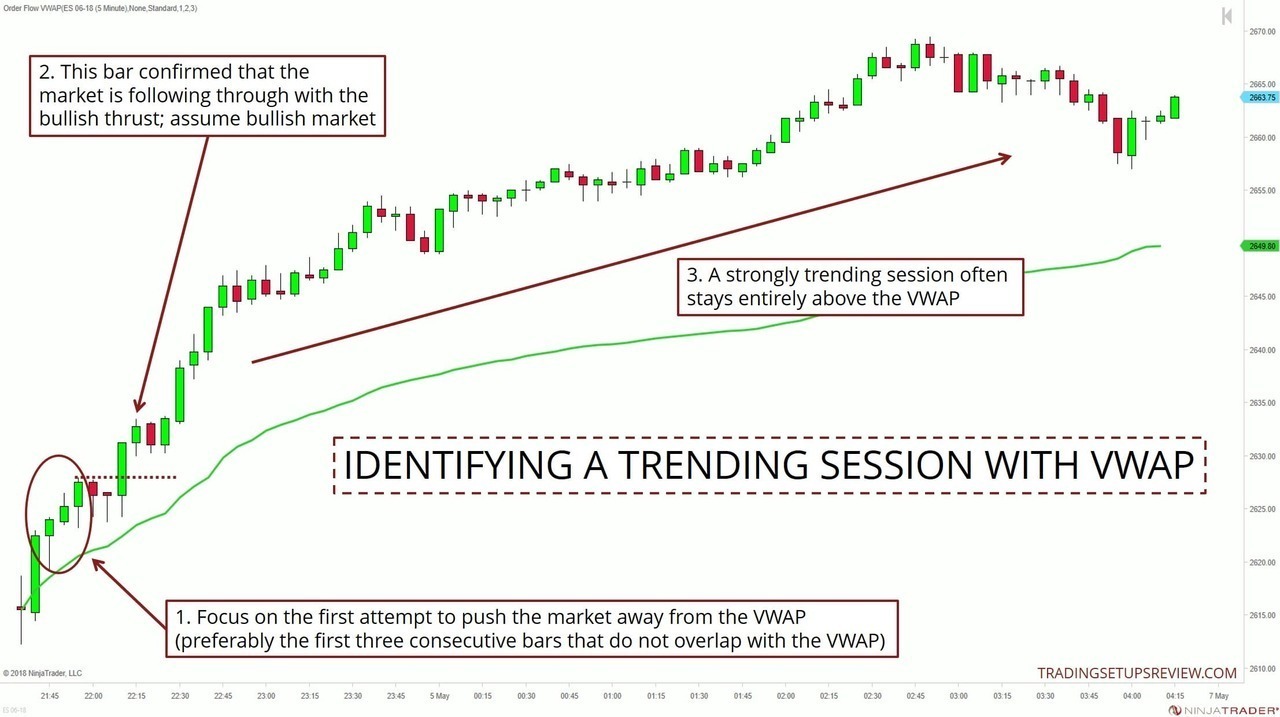
This example also demonstrates why the VWAP might be ill-suited for timing entries. For instance, if you intend to trade pullbacks to the VWAP, you will not get a chance to join this splendid bull run.
Hence, for timing your entries, consider a simple setup targeting aggressive trends. (E.g., The L3 entry of the Floor Trader System or the Trend Bar Failure)
In fact, if you’re convinced that a powerful trend is unfolding in front of you, don’t wait for a specific setup. Simply enter with a one-bar pullback and place a volatility stop to limit your risk.
Ranging Session Chart Example
When the market fails to move away from the VWAP, the likelihood of a ranging session increases.
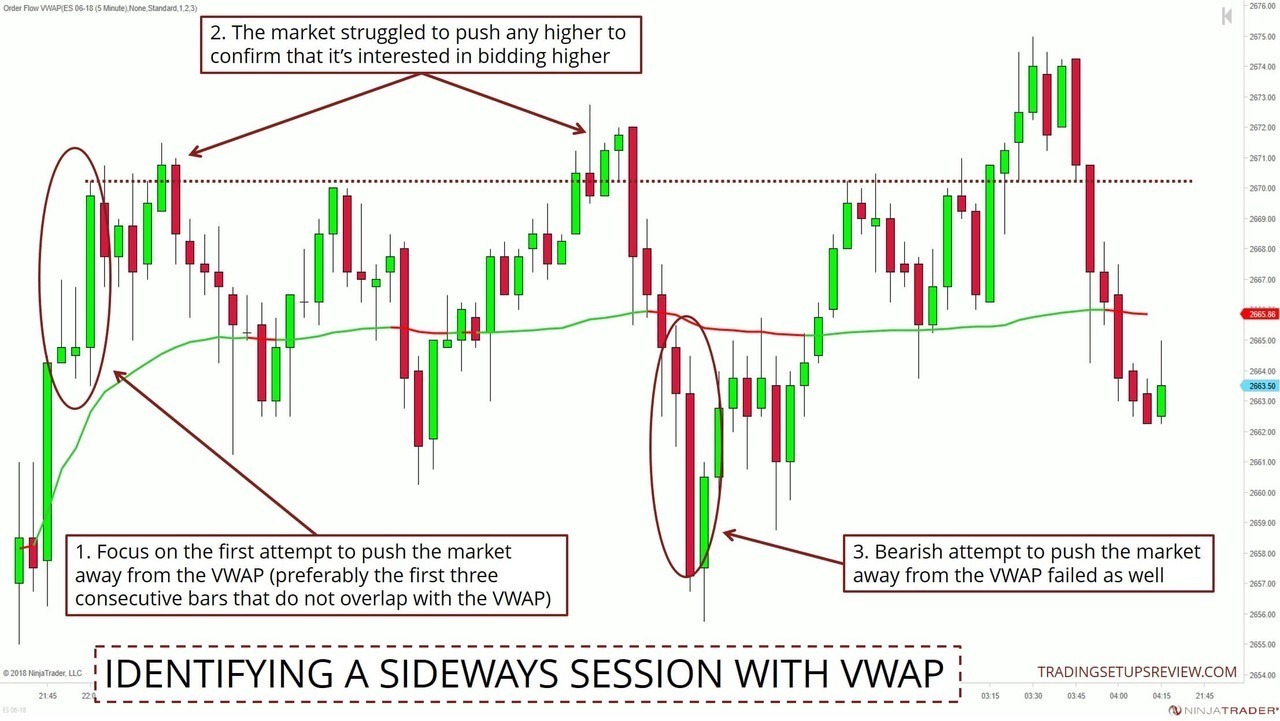
Paying attention to the slope of the VWAP yields useful information.
In the trending session example, the slope stayed positive throughout the session. On the other hand, a relatively flat slope means that there’s not much trending action.
Note on staying out at the opening of a trading session:
At the beginning of each session, the price bars tend to overlap with the VWAP. According to our method here, you cannot judge the market bias until the market tries to move away from it.
Hence, you should stay out of the market until prices diverge sufficiently from the VWAP. This means sitting on your hands around the session open.
This technique ties in neatly with the standard advice of staying out of the market for the first 15 or 30 minutes. Except that the VWAP tells you when it’s okay to consider an entry, rather than prescribing an arbitrary no-trade period.
Moving On With The VWAP
As this is a beginner guide, we chose to focus on clean and neat examples above. As you try to apply the VWAP on your charts, you will inevitably find messier price action. In such cases, take your time to observe patiently, and you’ll gain greater insights on its usage.
Once you’re comfortable with the basics, you can explore more advanced aspects of the VWAP. Below are some handy resources.
VWAP Bands
VWAP bands are lines above and below the VWAP projected with multiples of the standard deviation. Think of it as Bollinger Bands with the VWAP as the middle band.
You can use these bands for:
- Gauging the strength of the trend
- Profit-taking
- Timing trade entries (Especially in a ranging market, in a way similar to how Bollinger Bands are used in the Gimmee setup.)
MIDAS
The VWAP only works with intraday data. If you want a similar tool that works on daily and above time frames, check out the MIDAS trading framework.

Automated Trading and Testing With The VWAP
The VWAP opens exciting possibilities for developing and evaluating intraday trading algorithms.
A few examples:
- Can You Really Make Money With VWAP? Two Trading Systems Put To The Test
- VWAP Day Trading Strategy
- VWAP Strategies [PDF]
If you’re new to systems trading, check out these affordable courses to get started.
Charting Platforms With the VWAP
The VWAP might not be available on all charting platforms.
Here are our recommendations for platforms with the VWAP:
- NinjaTrader 8 - VWAP added for Lifetime Licenses as part of the Order Flow suite. (We used this for the charts above.)
- TradingView - VWAP available for both free and paid subscriptions. (Sign up for a free account/trial here.)