Swing Trading Strategy with Multiple Time-Frames
By Galen Woods ‐ 8 min read
Using multiple time-frames in your analysis is a solid method to find high probability trades. Learn a simple dual time-frame method for swing trading.
Seeking confluence is a central theme in technical analysis. High-quality trades enjoy confirmation from different analytical methods. Other than varying your trading tools, you can also look for confirmation from a higher time-frame. This is why multiple time-frames analysis is a popular method among swing traders.
Using multiple time-frames in your market analysis is a simple way to align yourself with the big picture. For technical trading, this approach translates to having various charts with each chart showing a different time-frame.
There’s a key drawback of using more than one time-frame.
Each time-frame dilutes your attention. And it takes great effort to relate different time-frames to one another. Yet, as a trader, both your attention and effort are limited.
Hence, go easy with the number of time-frames.
This is also why in this article, we will look at a dual time-frame swing trading strategy.
It uses only the simple moving average (SMA) and price action candlesticks operating on two time-frames.
Trading Rules - Swing Trading with Multiple Time-Frames
Swing trading aims to hold positions over a few days to a few weeks.
Hence, the daily time-frame is our primary window of analysis. The weekly chart then offers us a big picture view.
The slope of the 20-period simple moving average (SMA) is a straightforward way to observe the trend. Hence, we will use it in both time-frames.
As you’ll see in the trading rules below, we are interested in identifying when the price action in the two time-frames diverges.
Bullish Trading Rules
- The weekly SMA slope turns positive. (Indicates a change to bullish bias)
- Then, wait for the daily SMA slope to turn negative. (Pullback trade opportunity)
- Place a buy stop order above the lowest swing high above the SMA on the daily chart.*
- Cancel the buy stop order if the weekly SMA starts to slope downwards. (Invalidates our bullish bias)
* You will probably need to adjust your buy stop order downwards as lower swing highs form.
Bearish Trading Rules
- The weekly SMA slope turns negative.
- Then, wait for the daily SMA slope to turn positive. (Pullback trade opportunity)
- Place a sell stop order below the highest swing low below the SMA on the daily chart.*
- Cancel the sell stop order if the weekly SMA starts to slope upwards.
* You might need to adjust your sell stop order upwards as higher swing lows form.
Trading Examples - Multiple Time-Frames
In the charts below, the top panel shows the daily bars, and the bottom one shows the weekly bars.
The 20-period SMA’s color changes according to its slope.
Example #1: Triangle Bullish Breakout
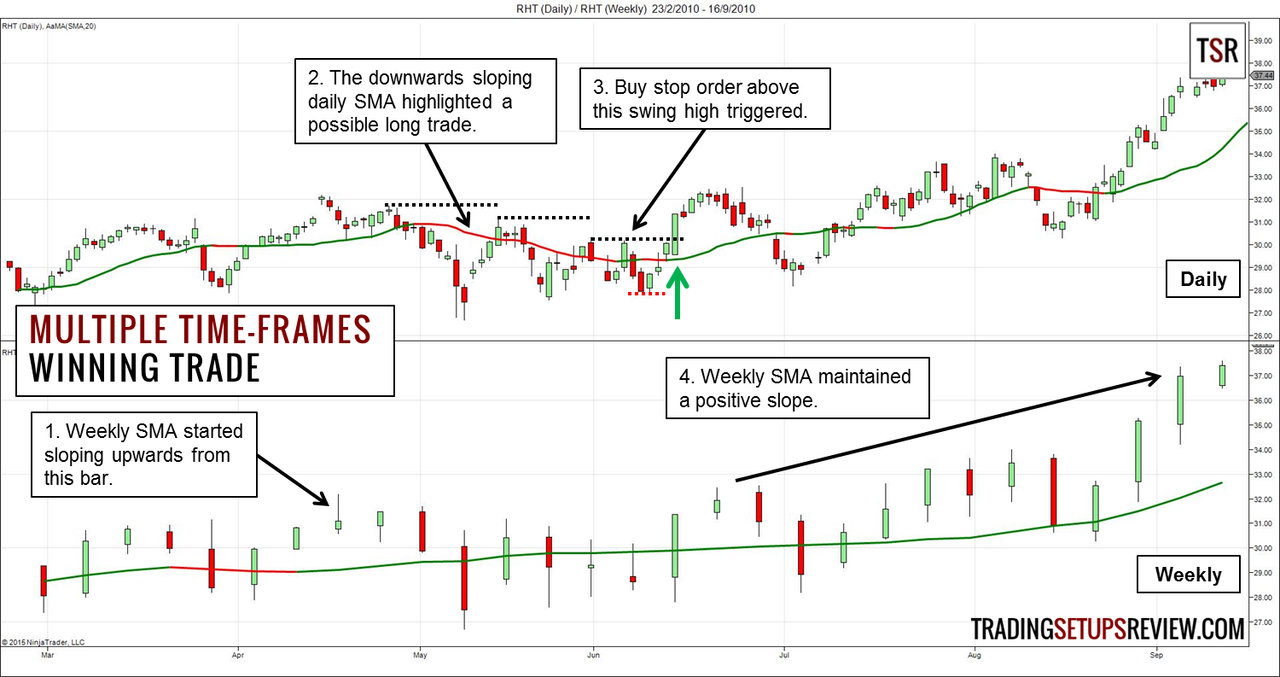
The chart above shows the price action of Red Hat Inc. (RHT on NYSE)
- The weekly SMA turned upwards at this bar. It was a sign of a bullish price context.
- We sat tight until the daily SMA turned red (sloped down). It presented a possible long pullback trade.
- We placed a buy stop order according to the swing high formed above the SMA. We trailed the buy stop order down as new swing highs (black dotted lines) formed. Finally, the buy stop order at this price level was triggered. The most recent swing low (red dotted line) became our stop-loss level.
- After our long entry, the daily chart printed two deep retracements down. However, the weekly SMA maintained its positive slope despite these retracements. This observation encouraged us to let our profits run.
Example #2: Losing Short Trade
This is a dual time-frame chart of the Intercontinental Exchange (ICE on NYSE).
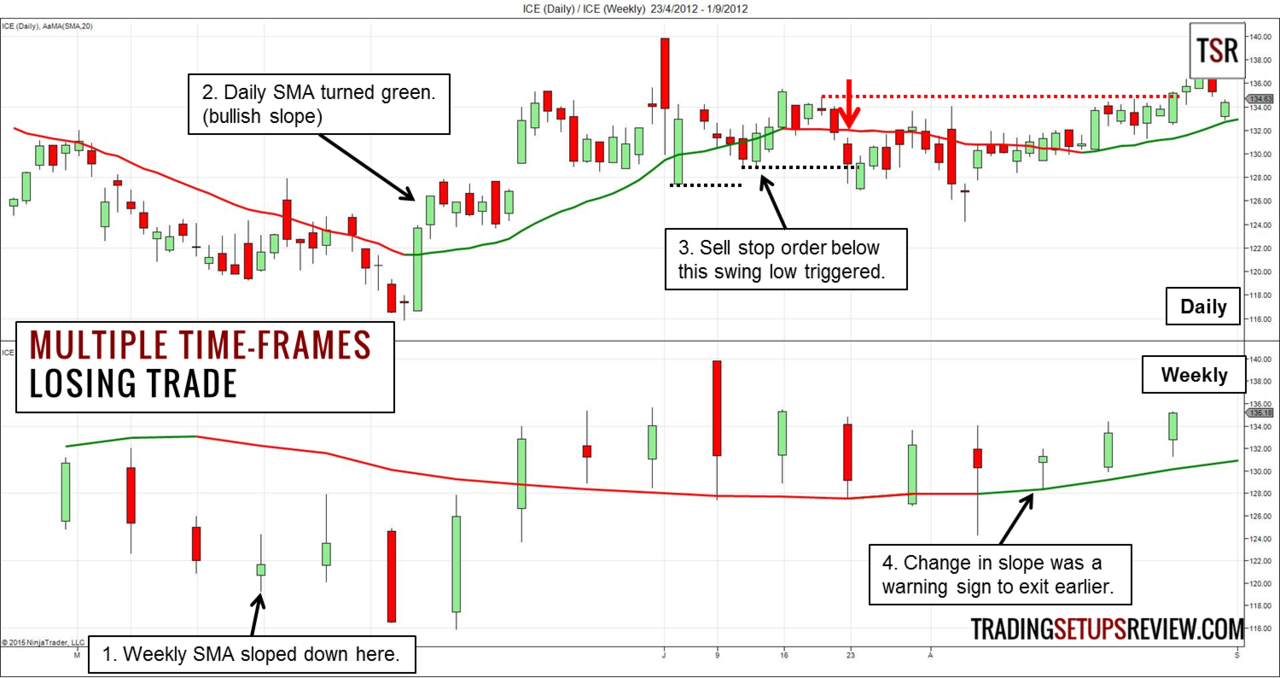
- After three consecutive lower closes on the weekly chart, the SMA turned downwards.
- The bullish slope of the daily SMA gave us the signal to look for short setups.
- It was almost a month later that a swing low formed below the daily SMA.
- If the weekly SMA had sloped up as a result of this bullish drift, we would have avoided this trade. However, the weekly SMA was still sloping down. Hence, we placed and adjusted the sell stop order according to the swing lows. The red arrow points to the bar that triggered our sell stop order.
- The weekly SMA turned up before our initial stop loss (dotted red line) was hit. Nimble traders might’ve taken that as a signal to scratch the trade for a small loss.
Although this trade conformed to our trading rules, the market price action warned against it.
On the weekly chart, three bars formed entirely above the SMA. It was a clear sign of bullish momentum on the higher time-frame.
On the daily chart, prices stayed above the SMA for 19 consecutive bars. The sustained bullish price action was undeniable.
Hence, both time-frames did not bode well for bearish traders.
As an exercise, compare and contrast the price action during the pullback against the trend between Example #1 and Example #2. How are they different?
Example #3: Catching A Bullish Market
This example and the next one have background highlighting for ease of spotting more subtle changes in the SMA slope.
- The red background indicates a downward sloping moving average for that period.
- Accordingly, the white background means a positive moving average slope.
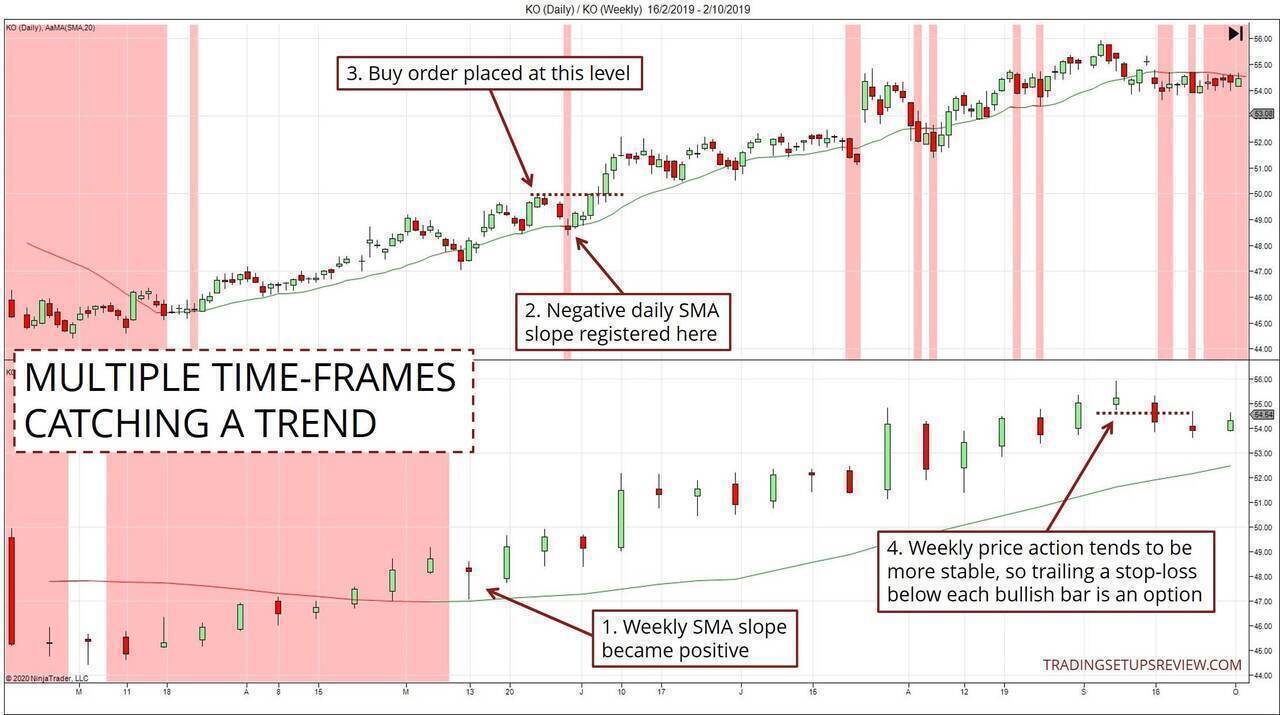
- The weekly chart turned bullish at this point. We turned on our radar for bullish trades and zoomed into the daily chart.
- This negative SMA slope was the daily chart signal we were waiting for. This negative slope indicated the pullback we wanted to see.
- Hence, we placed a buy stop order at the last trend high. Typically, we expect more swing lows to form as the market pulled down, allowing us to adjust the buy stop order downwards. However, in this case, the market sprung back up and triggered the initial buy stop order.
- Weekly charts are more stable and exhibit fewer whipsaws than their daily counterparts. Hence, a simple trailing stop-loss can work well. In this case, trailing a stop-loss just below each bullish weekly candlestick turned out to be ideal. (If you want to explore this method of placing stop-loss, consider ignoring bullish inside bars.)
Although this trade turned out fine in hindsight, some traders might not be comfortable with buying at the trend high. This is understandable.
However, the critical consideration here should be your reward-to-risk ratio and trading horizon.
Rather than enforcing a strict rule of not buying at the trend high, consider the following:
- Where is your stop-loss?
- What’s your profit potential?
- Are you targeting to hold your position for a few days in the market? Or are you seeking to ride the trend for a longer-term?
Here, we limited our potential loss by using the daily time frame to tighten our stop-loss. Then, intending to let profits run with the weekly chart as a basis, we aimed for higher profit potential. Hence, the reward-to-risk assessment seemed reasonable.
Example #4: Keeping Us Out
This trading example is unusual, in that there are no trades in this example.
A trading approach’s utility is not just in getting us into the market. Its value also lies in its ability to keep us out.
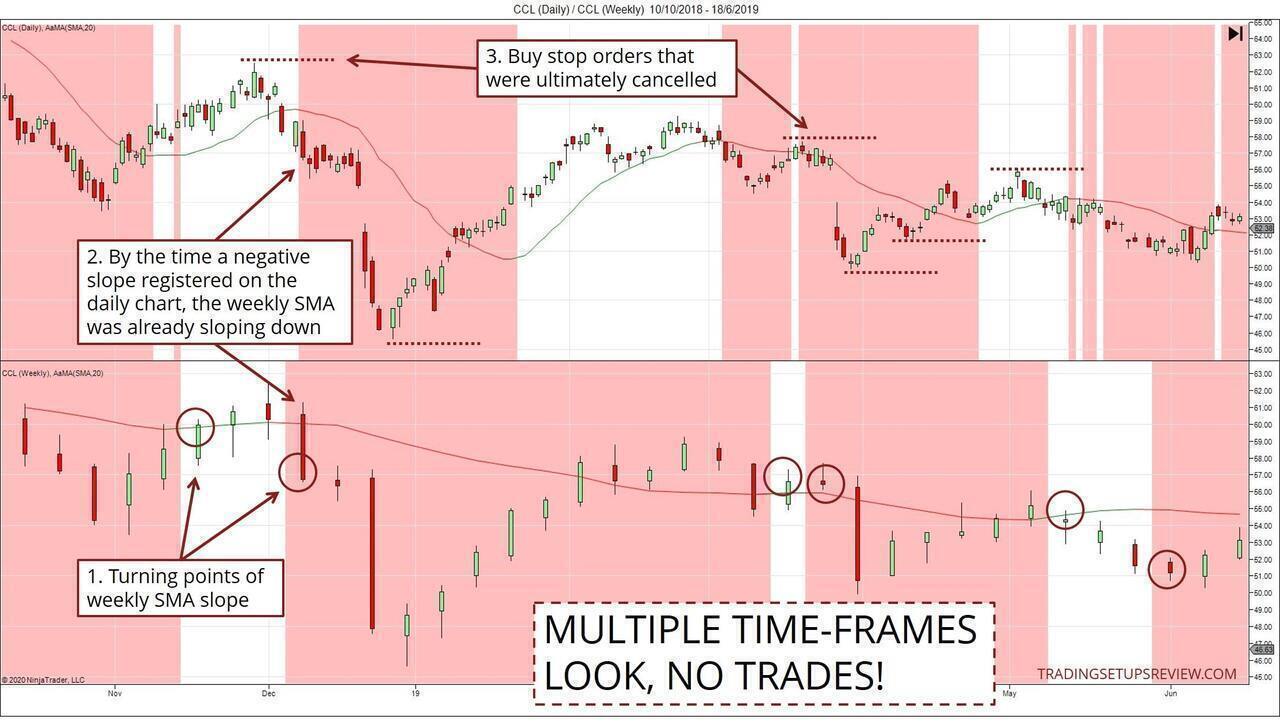
- Each of the circled weekly candlesticks conformed to the rule #1 of our strategy. (i.e., a change of market bias according to the higher time-frame)
- However, if you followed the subsequent rules, you would not find any entry setups. There were neither long nor short entries to be taken.
- The dotted lines on the daily chart represent entry orders that were ultimately canceled due to a change in the weekly slope. (according to rule #4)
Now, take a step back and look at the overall daily chart. You will notice a prolonged triangle formation showing clear congestion.
This pattern is apparent in retrospect. But it was not easy to see this in real-time and stay out of the market. Our dual time-frame approach has helped us in this regard.
During this period, there were short thrusts in both directions. But no major trend developed.
If our aim is to participate in significant trends, this trading approach has effectively kept us out of the market. We get to preserve our precious trading capital for other opportunities of higher quality.
Strategy Review
This dual time-frame trading strategy is a basic multiple time-frame approach. Its simple design helps the trader gets confirmation while staying close to price action.
We can improve this strategy by adding more time-frames or indicators. Other multiple time-frames trading setups use up to three time-frames with different technical indicators.
Want to add another time-frame to this trading strategy?
- Consider using the monthly time-frame to check the market tide. Helpful for long term position trading.
- You can also drill down to lower time-frames (e.g., hourly) to refine your entries and further tighten your stop-loss. It is an excellent way to cut your trade risk.
However, before adding more time-frames or indicators, pay closer attention to the price action. You can uncover helpful insights by scrutinizing the price action as the two time-frames diverge. These observations can help you identify better quality trades and avoid the inferior ones.
Multiple time-frame trading strategies are robust trading methods as they consider the larger picture.
But they are by no means the Holy Grail. At times, the larger picture will cause you to enter too late or skip a profitable trade. Learn to take these necessary sacrifices in stride.
To learn more about multiple time-frame analysis, I recommend these books.


(for Alexander Elder’s Triple Screen Trading System)
Also, take a look at other multiple time-frames trading strategies covered on TSR.
The article was first published on 6 January 2015 and updated on 16 July 2020.