7 RSI Trading Strategies That Will Boost Your Trading Prowess
By Galen Woods ‐ 4 min read
The Relative Strength Index (RSI) is an extremely versatile trading indicator. Learn how to adapt it to your trading style to boost your trading ability.
The Relative Strength Index (RSI) designed by J. Welles Wilder is a popular and versatile trading indicator.
You can vary its lookback period, combine it with different trading tools, look for divergences, and even draw trend lines on it. Each method produces a unique tool that enables diverse strategies.
Here you will find seven RSI trading strategies that showcase the different facets of this powerful indicator. Before you jump in to explore the trading strategies below, make sure you understand the basics of the RSI indicator.
Also, bear in mind that these trading strategies are not perfect and are unlikely to be profitable when traded mechanically.
However, by examining these diverse RSI trading methods, you will gain helpful insights into J. Welles Wilder’s most famous indicator.
List of RSI Trading Strategies
- 2-Period RSI
- RSI with Support & Resistance Zone For Day Trading
- Divergence with Candlestick Patterns
- Trend Confirmation (Midline Analysis)
- Failure Swing
- Trend Lines
- Range Shift
Strategy #1: RSI2
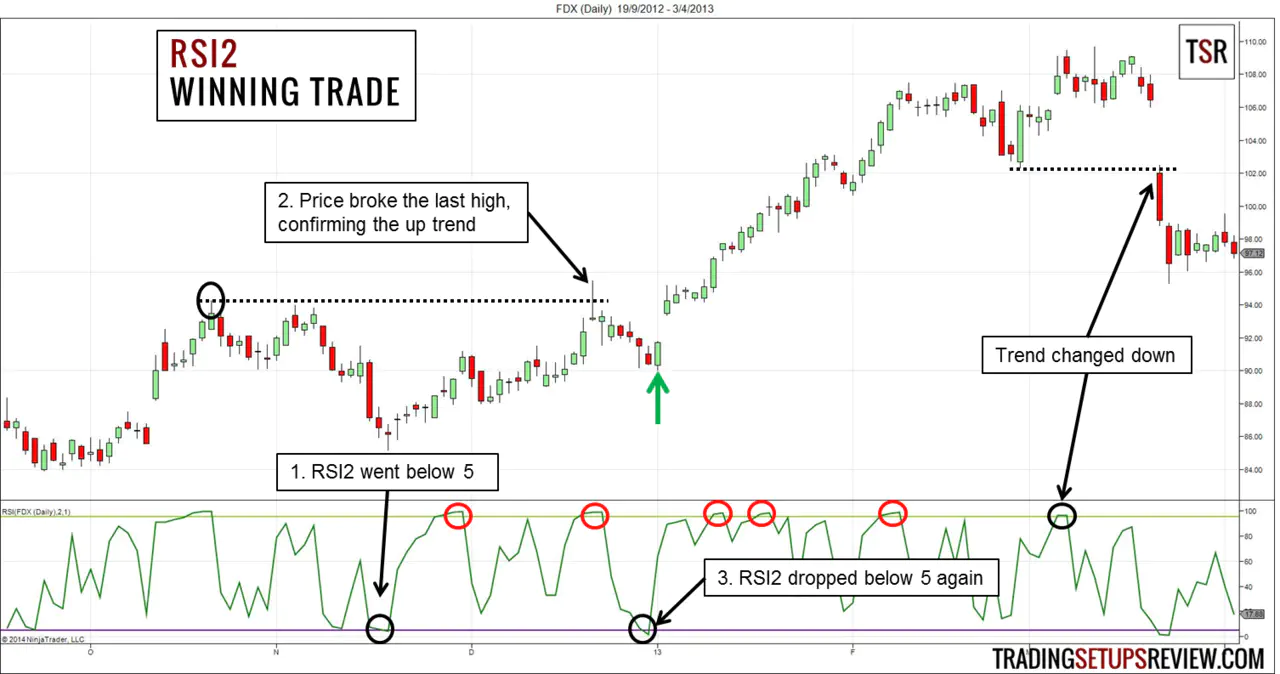
The 2-period RSI is the brainchild of Larry Connors. This unconventional lookback period turns the RSI into an incredible short-term timing tool.
Learn more with these links:
- Explanation of the original RSI2 strategy by ChartSchool
- A modified approach that uses the RSI2 for determining the market bias as well
Strategy #2: RSI + S/R (For Day Trading)
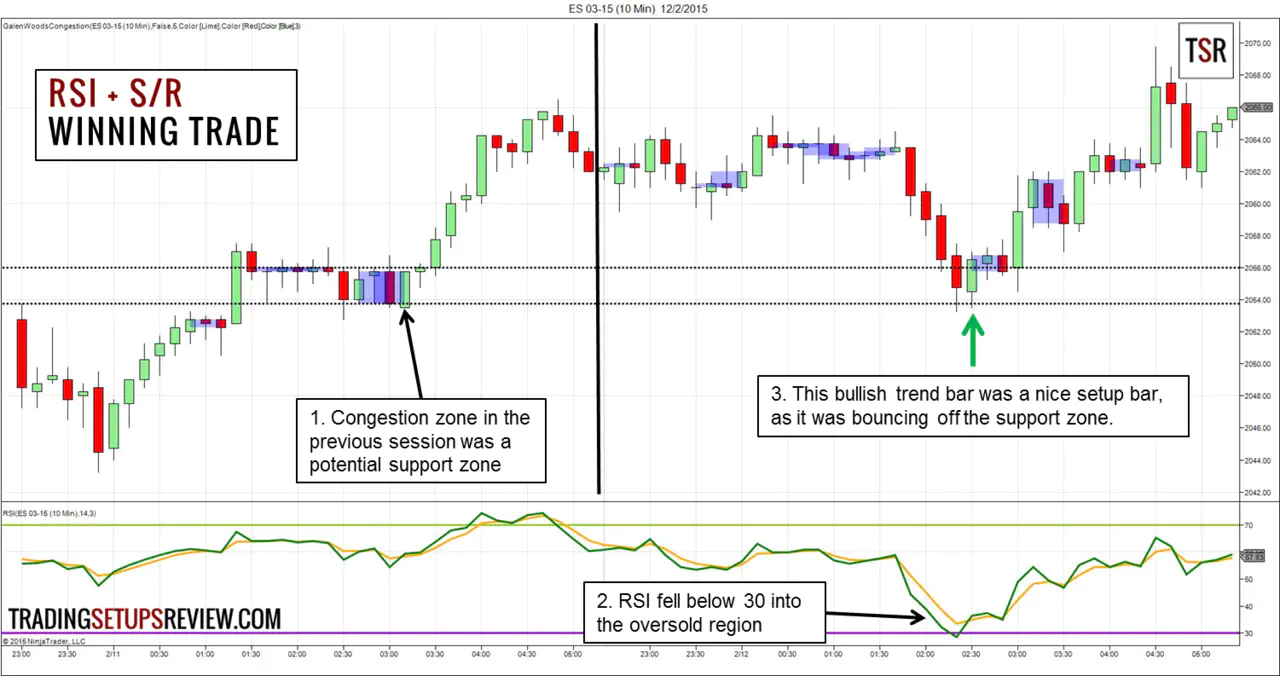
If you think that trading is like hunting, you will agree that patience is a virtue. This trading method works well for the patient trader.
Its premise is simple. It looks for support and resistance zones to confirm oversold and overbought signals respectively.
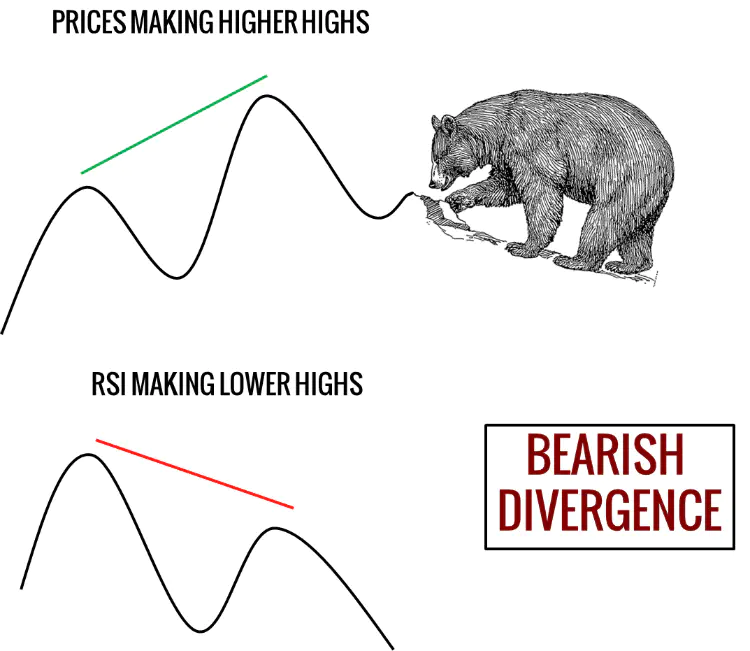
Strategy #3: RSI Divergence + Candlesticks
Candlestick patterns alone are never sufficient to call a market top or bottom. You need a tool that can point you to what’s happening in the broader context.
The RSI can fulfill this role if you use it the right way - to identify price divergences.
Strategy #4: RSI Midline For Trend Analysis
The 30 and 70 lines indicate oversold and overbought respectively in the standard RSI interpretation. But they are not the only lines you should observe.
Another equally significant level is the midline at 50. If the RSI stays above 50, it’s likely to be a bullish market. If the RSI remains below 50, a bearish market is dominant.
These are two strategies that make use of this observation:
Both setups combine a moving average with the RSI indicator. However, they are not gunning for the same trades. Study them side-by-side to uncover their differences.
Strategy #5: RSI Failure Swing
Wilder saw the RSI Failure Swing as a powerful reversal signal.
One important principle for the Failure Swing is that it is independent of price. The implication here is that you should ignore the usual RSI divergences.
These two articles have excellent sections covering RSI Failure Swings. For each link below, you need to scroll down to the Failure Swings section.
Strategy #6: RSI Trend Lines
The RSI allows for direct trend line analysis. It means that you can draw trend lines on the RSI just like what you usually do for price action.
This article from Trendline Mastery shows a detailed RSI trend line trading example using multiple time frames (from the weekly down to the 4-hour chart).
Strategy #7: RSI Range Shift
Andrew Cardwell developed a framework to categorize market conditions with the RSI.
This concept might look intimidating and radical at first. But its core idea is simple.
The premise is that the RSI is typically trapped within a range, given a market mode (e.g., bullish, bearish, sideways, etc.). Think of it as an advanced version Strategy #4 above that uses the RSI midline.
This article has an image that explains the five types of range shift for the RSI indicator.
The first chapter of this book by Constance M. Brown is titled Oscillators Do Not Travel Between 0 and 100. It covers the concept of RSI range shifts.

That’s it!
Here are seven trading strategies that can empower your RSI analysis. But do not try to apply them all at once. You will get confused if you do that.
Go through them one by one, and pick out those that truly benefit your current trading style.