How To Identify Demand and Supply Using Price Action
By Galen Woods ‐ 5 min read
Demand and supply underlies all market price action. Market movements offer the best clues to identifying critical turning points for profitable trading.
Want to find demand and supply in the market? Just look at the market depth screen and you will see orders to buy and sell at different prices. Those numbers show demand and supply.
That’s all. You’ve found demand and supply. What can you do with it? Nothing.
Now, think again. Do you really want to find demand and supply?
In a liquid market, there is constant supply and demand. People are always willing to buy and sell at different prices. Demand and supply are everywhere. There is no need to find them.
What you really want to find are the price zones where supply overwhelms demand and where demand overwhelms supply.
- The former is known as resistance. When the market bumps into resistance, price will drop. Then, you can make money by shorting the market.
- The latter is market support. With the support of demand, price will rise. Then, you can profit from a long position.
In a nutshell, we want to find market turning points, and not merely demand and supply. Follow the three steps below to find and trade these profitable turning points.
1. Focus on a price level (zone)
It’s difficult to analyze the market without a focal point. If you look for turning points at every price level, you will only find confusion.
How do you know which price level to focus on? Which price levels are potential market turning points?
There are many ways to find potential turning points. You can use swing pivots, calculated pivot points, Fibonacci levels, and volume signals. Learn about these methods and make use of those that make sense to you.
Example
In this example, I focus on a valid swing pivot. (The concept of a valid swing pivot is explained in my price action course. Essentially, it is a form of major market pivot.)
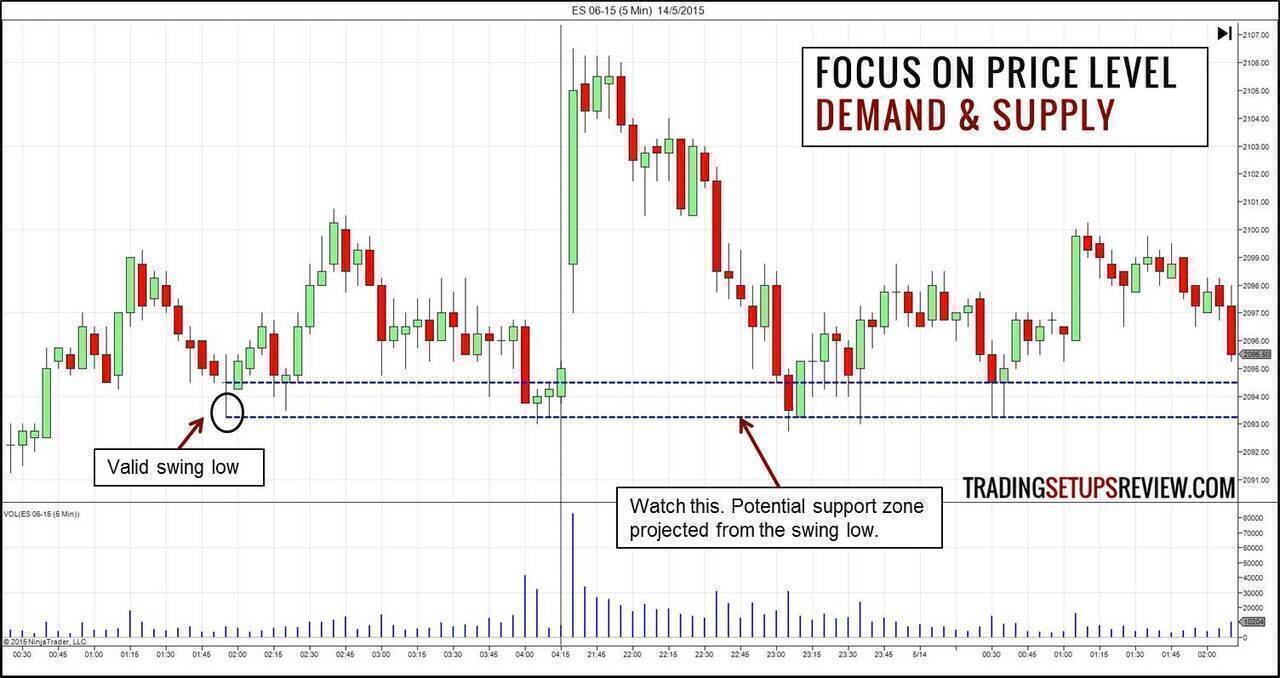
The ES 5-minute chart above shows a valid swing low. Pay attention to this price zone to find out if demand prevails.
2. Observe what happened (happens) at the potential support/resistance
Signs of strong demand
When the market tests a potential support, look out for:
- Bullish price pattern
- Inability to clear below the support
- Increased volume
- Congestion
Signs of strong supply
When the market tests a potential resistance, look out for:
- Bearish price pattern
- Inability to clear above the resistance
- Increased volume
- Congestion
Look for these price action signals in the past, as well as in real-time price action. The more signs you see, the more likely you’ve found a true support/resistance zone.
Example
Let’s take a closer look at the same ES 5-minute chart to check the price action.
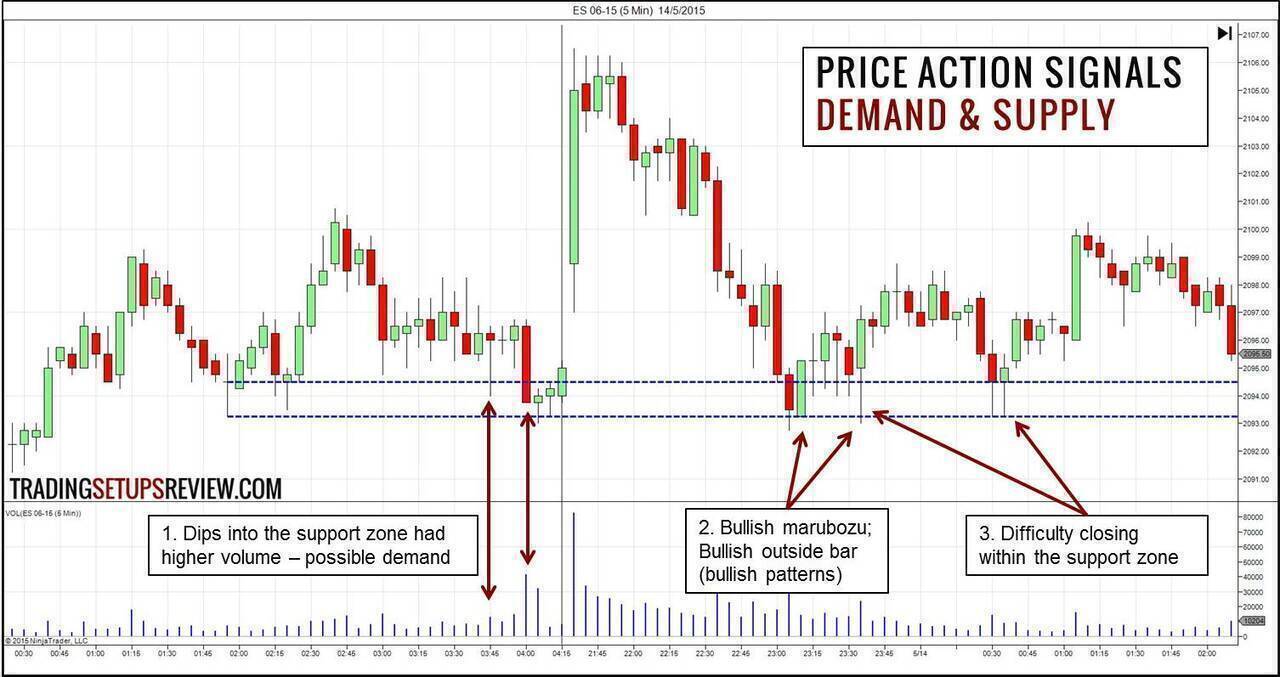
- Volume increased as the market dipped into the price zone. It was a clue of a demand surge.
- Bullish price patterns formed as the market tested the support zone. (Marubozu and Outside Bar)
- It was clear that the market had difficulty closing within or below the support zone.
These signs confirmed that demand would likely overwhelm supply in the indicated price zone.
3. Limit your risk
Once you’ve found a potential support or resistance level, remember the word “potential”. It is a tendency and not a guarantee.
Hence, you should limit your risk when you trade supply and demand zones. There are two trading approaches to do so.
Method One - Demand Confirmation
Let price show you the way. Look for price patterns. Then, use stop orders to enter as the market confirms your opinion.
You will enter late, but you will save yourself from many bad trades. The main drawback of this strategy is that you will enter at a worse price. Hence, use this strategy only when you expect significant profit potential. Otherwise, the reward-to-risk ratio is too low.
Method Two - Trade Aggressively
Get in early (without confirmation) with a tight stop-loss and a conservative target. In this case, use a limit order placed within the support/resistance zone.
This strategy is ideal when you are:
- Confident of the demand and supply conditions;
- But are uncertain of how far the market would go.
Example
In our ES 5-minute example, the support zone looked reliable. Hence, we were confident that demand would stop the market decline.
However, given that the market has been falling, long positions were against the recent trend. It was unwise to set ambitious profit targets.
Under such considerations, the aggressive trading approach is suitable.
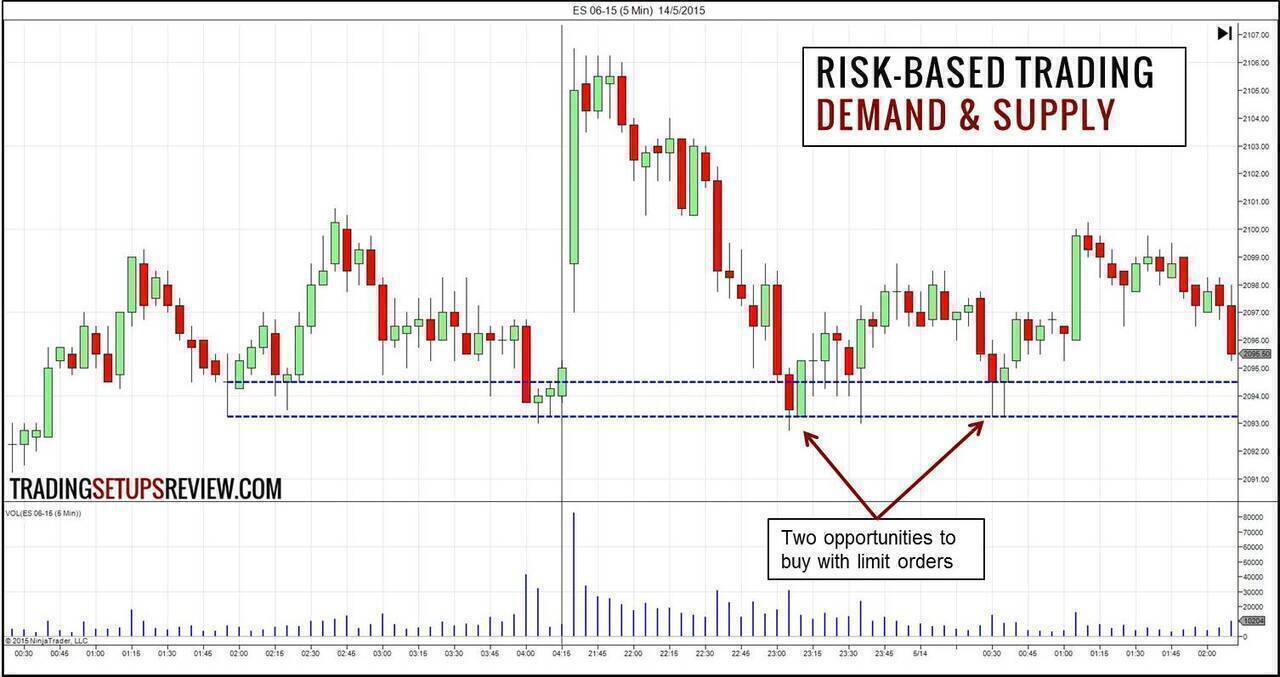 A consistent stop-loss and target of 2 points will work for both trades. It produced two swift and high probability scalps. (The stop-loss and target depends on the market volatility.)
Use Price Action to Understand How Demand and Supply Interacts
Remember that you are anticipating the strength of demand and supply. We are interested in their interaction.
- Will demand conquer supply at this price level?
- Will supply overwhelm demand at this price level?
- What does this (series of) price bar(s) tell me about demand and supply?
These are the questions you want to think about as you go through the three steps above.
As our example showed, the market context is crucial. It helps you to tailor your trading approach to the market.
Hence, don’t focus on a simplistic definition of support and resistance. Spend your effort in studying price action clues to decipher demand and supply forces.