4 Price Action Methods to Define the Intraday Trend: Part II
By Galen Woods ‐ 3 min read
This final installment of the series looks at using simpler pure price action techniques to define the intraday trend for effective trading.
In the first part of this series, we discussed the role of price action in our analysis of the intraday trend. We also looked at two ways to define the intraday trend by combining simple indicators with price action.
Now, in this second and final part, we will look at the next two methods to decipher the intraday trend. These techniques focus on only price action.
3. Higher Time-Frames
As mentioned in the first part of this series, the trend is the big picture. It is a higher level perspective of the market. Hence, one popular method to determine the intraday trend is to look at the price action of a higher time-frame.
The example below shows how we used the hourly bar highs/lows to find the intraday trend for the 5-minute time-frame.
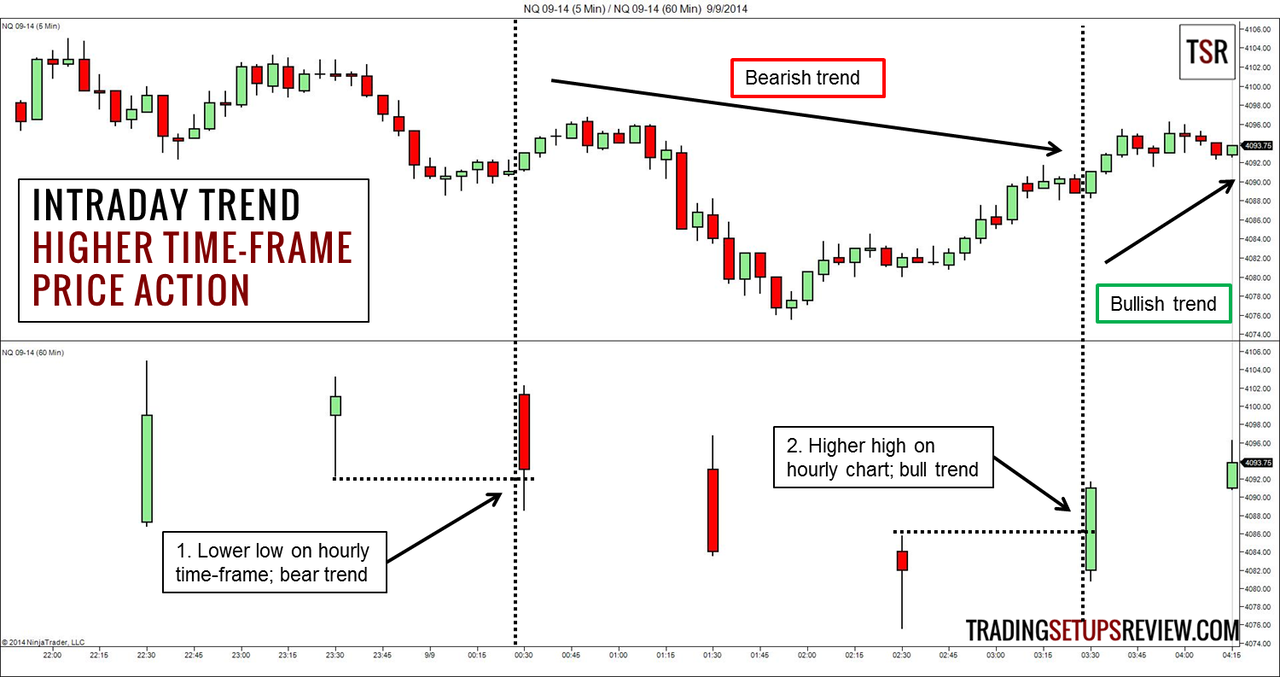
This chart shows the 5-minute time-frame in the top panel and the corresponding hourly chart in the lower panel.
- This hourly bar made a lower low and confirmed a bearish intraday trend.
- This bar made a higher bar high and turned the intraday trend bullish.
For more examples, refer to Kane’s Stochastic %K Hooks Day Trading Strategy. It is a classic example of using a higher time-frame for intraday trading. It uses the hourly chart to assess the intraday trend before trading in the five-minute time-frame.

is also a great starting point. In his solid system, he recommends a factor of five when considering higher-frames. An example would include the 1-minute, 5-minute, and 25-minute time-frames.
4. Trend Line
Price action traders love trend lines. It is useful for both intraday and longer term analysis.
By linking up swing pivots, we get trend lines of varying slopes and importance. Trend lines highlight the market structure of swings and project their momentum and speed.
The basic interpretation of a trend line is that the trend reverses after it is broken. The example below shows how a broken bear trend line hinted at the later bull trend.
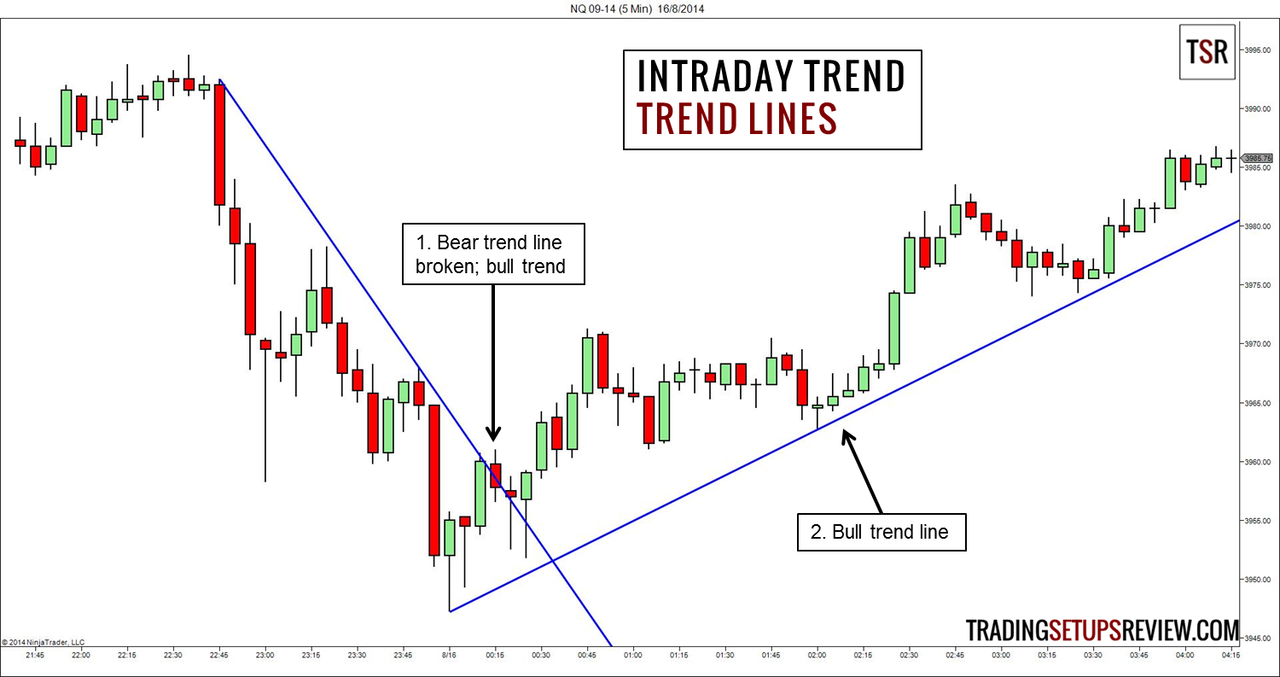
This method is simpler in the sense that it does not use any indicators and focuses on one time-frame. However, to make it work, you will need to master the skill of drawing trend lines.
The Best Method for Finding Intraday Trend
No method of determining the intraday trend is perfect. There will always be instances when the market resumes its earlier trend just as we conclude an intraday trend reversal. There will always be cases when we confirm a trend only when it starts reversing.
Such instances are unavoidable. This is why we have trading setups to pinpoint entries and limit our risk.
Each of the four methods above has its specific drawbacks.
For the two methods that rely partly on indicators (discussed in part one), we need to decide on the look-back period of the indicators. Without a sensible look-back period, the indicators will add little value to our trend analysis. The suitable value depends on the market volatility which is ever-changing.
The higher time-time method then depends on our choice of the higher time-frame. Which higher time-frame reflects the intraday trend? The half-hourly and hourly charts are popular among day traders. But forex traders might prefer the 4-hour time-frame.
As for the trend line method, the clear challenge is in drawing meaningful trend lines. If we draw trend lines indiscriminately, we will find more whipsaws than trends. The crux is to draw consistent and relevant trend lines.
If you want to pick up a consistent framework for drawing trend lines, take a look at my “Day Trading with Price Action” course. With dozens of step-by-step examples, you will learn to read market swings and build them up to draw the trend lines that matter.