How To Trade Stock Markets With Price Action
By Galen Woods ‐ 4 min read
Learn to appreciate the power of price action trading in large-cap stocks that are liquid and volatile through three detailed stock trading examples.
Can you apply price action for trading stocks? How about futures? Spot forex? Cryptocurrency? These are frequent questions I get in my email. The short answer is yes.
You can use price action trading in most liquid markets. Some price patterns might work better in specific markets. But these are observations you can only pick up as you trade.
This article is the first of a series that shows how price action analysis works in different markets.
Here, you will find detailed trading examples showing you how to apply price action in the stock market.
Large Cap Stocks - Price Action Intraday Trading Examples
For price action trading, liquidity and volatility are essential. Hence, I’ve chosen large-cap technology stocks for the trading examples below.
To keep things simple, I’ll stick to fundamental price action trading tools: trend lines and channels. (Note that they are not drawn haphazardly. They are drawn according to the rules taught in my trading course.)
We’ll also focus on a single price pattern: Trend Bar Failure. It is a versatile and straightforward price pattern. Click here to learn more.
Example #1: Facebook (FB) 1-Minute Price Action
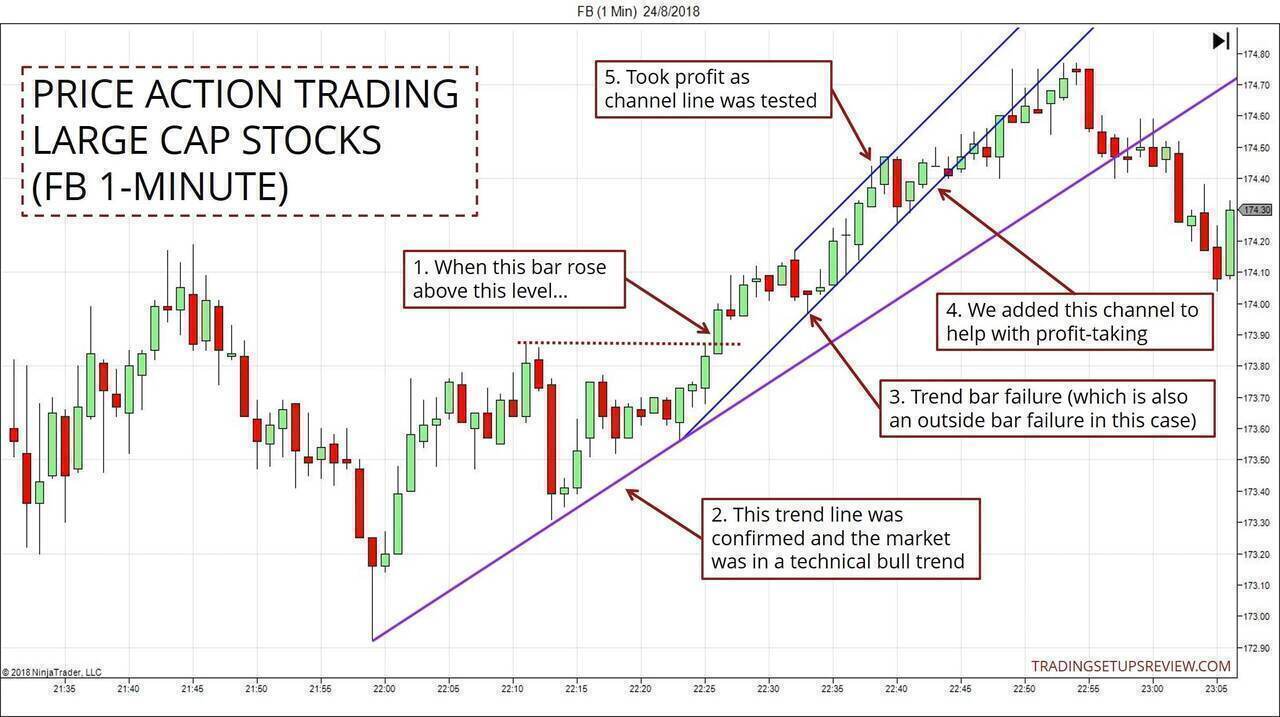
- This stock ranged sideways before forming a bullish structure. This bar was a critical juncture.
- It confirmed a bull trend line. The market was in a technical bullish bias.
- This was the first Trend Bar Failure after we drew the bull trend line. It was also an Outside Bar Failure.
- As the market pushed higher, we added a price channel to help with profit-taking.
- The subsequent test of the channel trend line was a chance for exiting with profits.
Example #2: CSCO 5-Minute Price Action
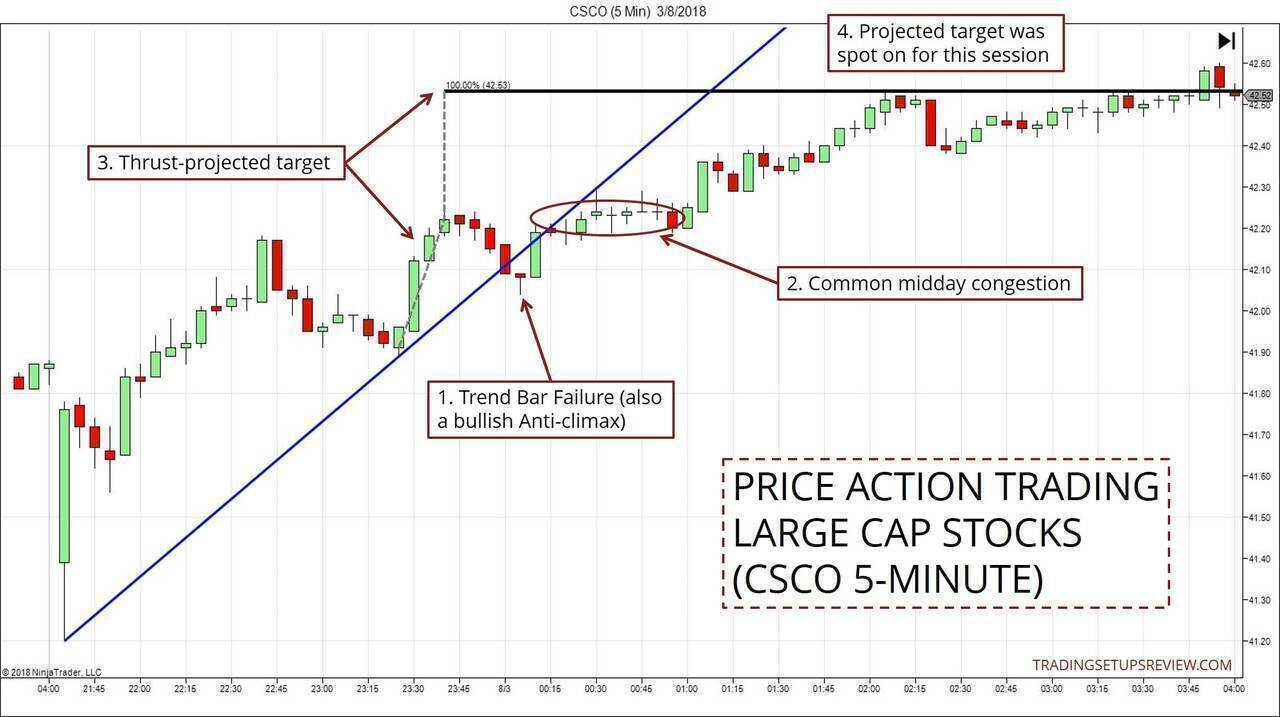
- This pullback against the new bull trendline ended with a Trend Bar Failure. It was also an Anti-Climax pattern - an exhaustive type price move. But it failed to reach the last swing low, implying impending bullishness.
- Depending on your trade management, you might exit during the midday congestion.
- However, if you held through, this thrust-projected target made sense.
- This stock trading session finished with a high around the projected target. It was an ideal outcome.
Example #3: MU 2-Minute Price Action
Example #1 and #2 above might look simplistic to you.
In some aspects, they are because I’ve left out the discussion of many nuances. I did that to ensure ease of understanding in this short article. (The subtleties include congestion, pressure zones, price momentum, and climactic patterns, etc.)
In this final example, we’ll advance a little and add more price action concepts. Work through it slowly and see how these ideas contribute to your stock market analyses.
Zone Color Legend
- Blue - Congestion Zone
- Green - Bullish Pressure
- Red - Bearish Pressure
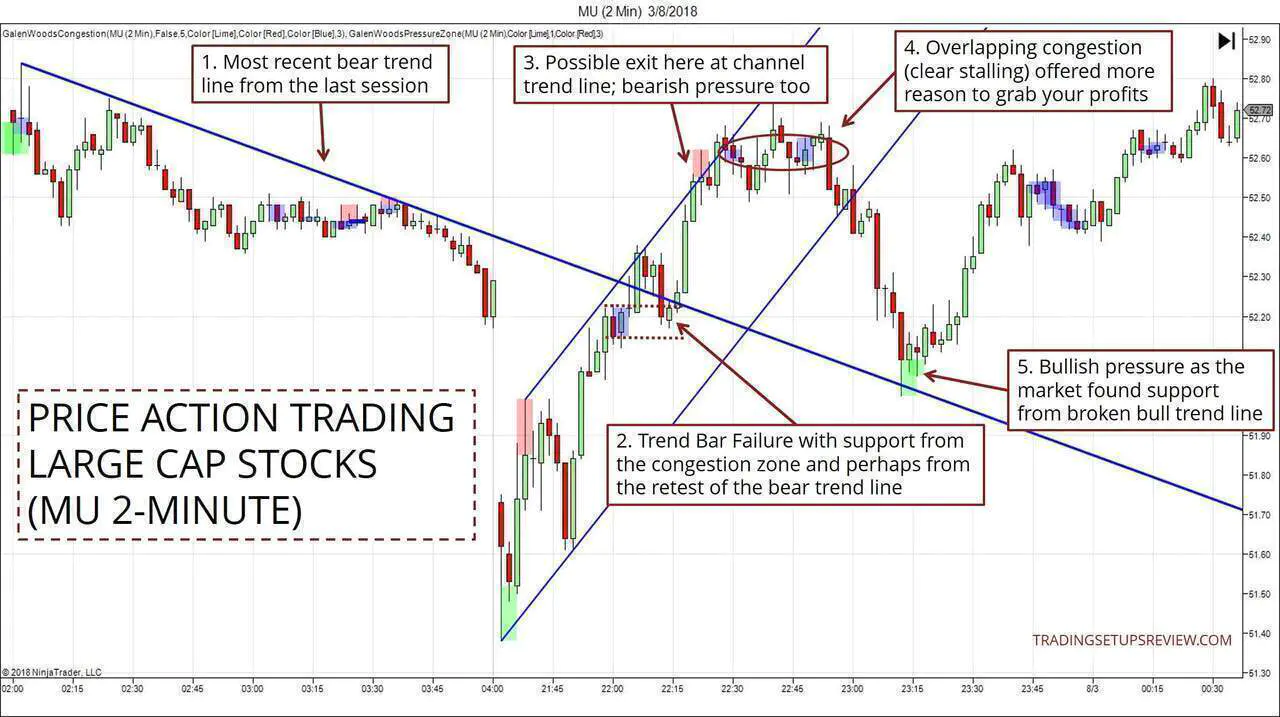
- The last trendline from the previous session can be helpful. In this case, it was a bear trendline.
- This bullish Trend Bar Failure formed at a congestion zone (a possible support level). At the same time, it was a retest of the broken bear trend line as support.
- As the market tested the channel trendline, bearish pressure developed. (Note red zone.) It was a reasonable point for profit-taking.
- The congestion zones showed that the market was stalling, offering a stronger case to grab your profit.
- As the market tested the broken bear trendline, bullish pressure showed up. (Note green zone.) On top of that, that price area happened to be in the 50% pullback zone of the session. These signs pointed to another opportunity to take on a long position. (This setup turned out to be one of the best trades available that session.)
Conclusion
This article seeks to show the relevance of price action techniques in stock markets. Do not treat it as a comprehensive course on price action trading.
Price action trading works in most markets. This is the beauty of a simple approach. But a working trading method is not the same as a profitable one. For that, you need to be patient, stick to a consistent plan, and record your observations.