This website or its third-party tools use cookies which are necessary to its functioning and required to improve your experience. By clicking the consent button, you agree to allow the site to use, collect and/or store cookies.
Please click the consent button to view this website.
I accept
Deny cookies Go Back
  • Price Action Trading Course – 50% Off Ends 29 June
  • Trading Setups
  • Topics ↓
    • Price Action Trading
    • Day Trading
    • Trader Development
    • Site Map
  • Trading Resources
    • TSR Trading Guides
    • Trading Journal Software
    • Our Partners
    • Support Us
  • Member Login

Trading Setups Review

Trading Strategies, Guides, and Articles for Active Technical Traders

Forex Tester 5 - Software for traders by traders
You are here: Home / Trading Articles / Day Trading With ADX Indicator

Day Trading With ADX Indicator

By Galen Woods in Trading Articles on June 20, 2013

The ADX indicator by J. Welles Wilder is a wildly popular indicator.

Many trading strategies like Linda Raschke’s Holy Grail and Jeff Cooper’s 5 Day Momentum Method use the ADX indicator to identify strong trends. However, day trading with the ADX indicator is not common.

The reason is while the ADX indicator is good at identifying strong trends, it is a lagging indicator. Lagging indicators might work for position trading, but are not acceptable in day trading.

In that case, is day trading with the ADX indicator possible?

Yes, if you are willing to give my 2-period ADX day trading strategy a try.

2-period ADX Indicator For Day Trading

For technical indicators, the shorter the period, the more sensitive it is to price action.

Hence, a 2-period ADX indicator is acutely sensitive to price movements. It responds quickly, but erratically.

Look at the 2-period ADX indicator on the 5-minute ES chart below. You will notice that it goes above 75 a lot more often than dropping below 25.

2-period ADX example
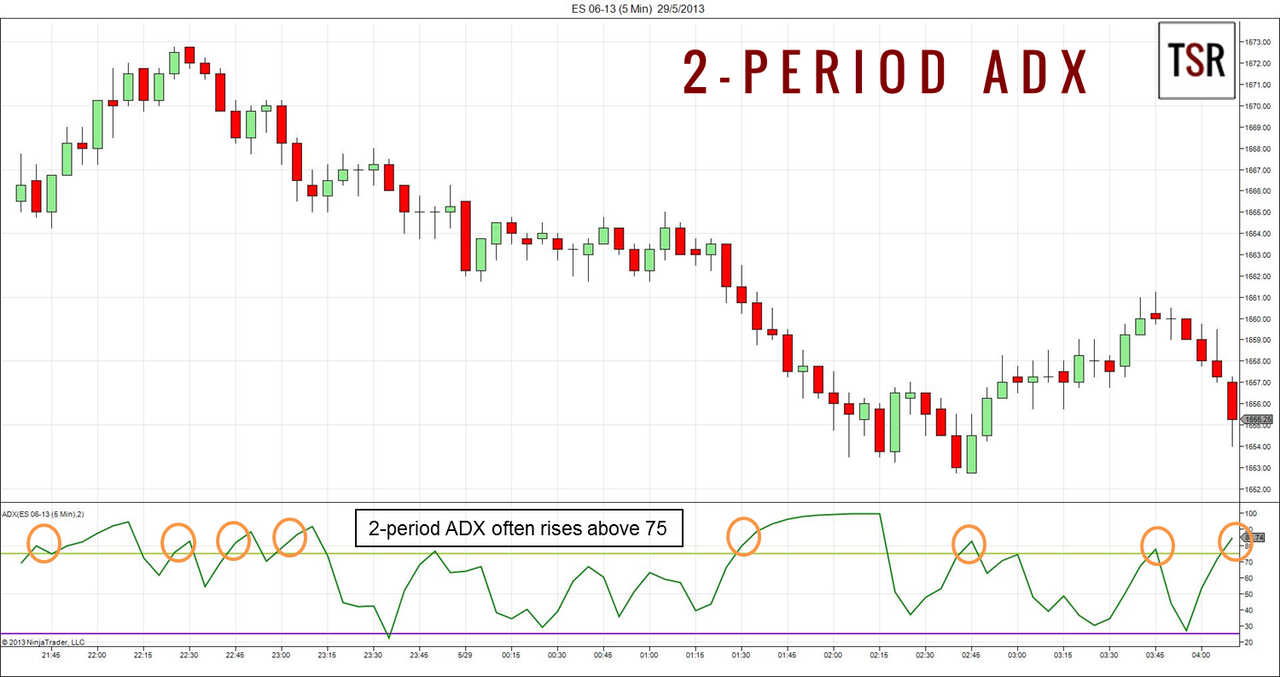
This phenomenon makes sense. Recall that the ADX indicator measures the strength of trends. ADX values above 75 mean extreme trendiness and values below 25 represent a lack of trend strength.

A 2-period ADX indicator is very sensitive. Thus, it detects small and fleeting trends and rises above 75 easily. These short-lived trends are common but not profitable for trading.

On the other hand, it takes lots of inaction for the ultra sensitive 2-period ADX indicator to drop below 25.

When it does drop below 25, it has found the rare eye of the storm, the absolute calmness before a significant breakout.

Trade Breakouts With ADX Indicator

When day trading with the ADX indicator, we focus on the 2-period ADX falling below 25.

When that happens, we prepare ourselves for trading break-outs into potent new trends.

Day Trade with 2-Period ADX
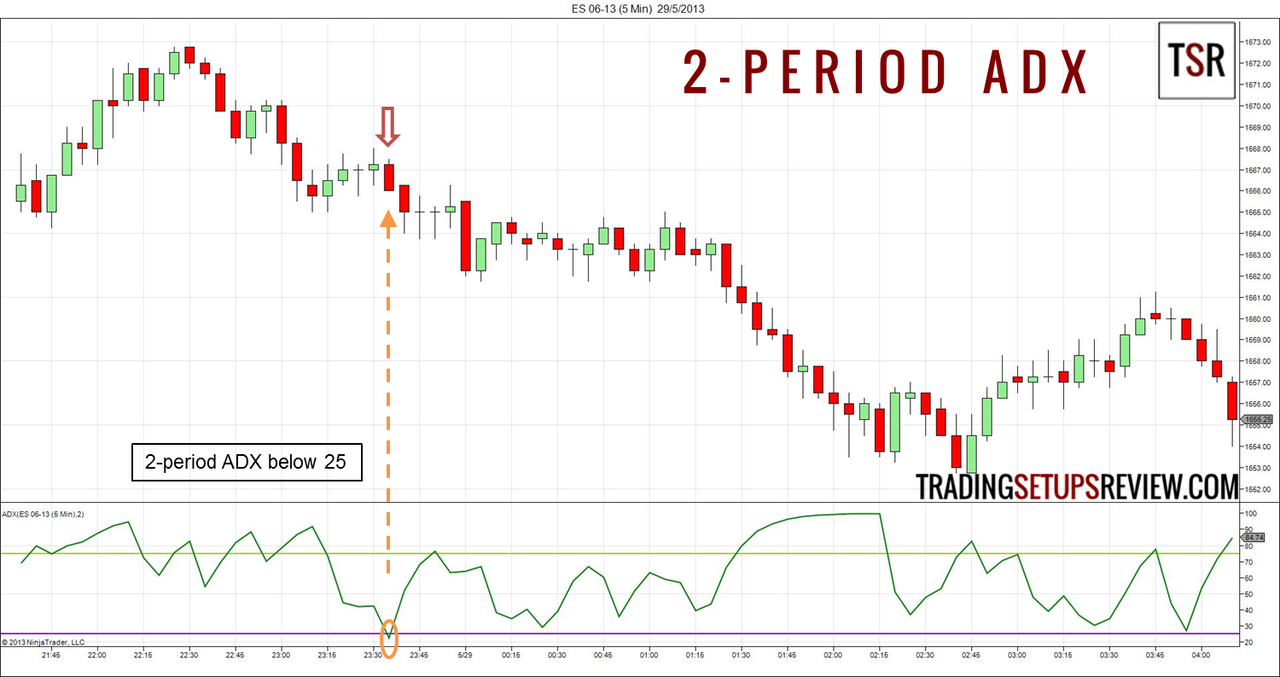
In this trading session, the 2-period ADX indicator fell below 25 to indicate the perfect pause.

Use bracket orders that include a buy stop order above the signal bar and a sell stop order below it. Once one of the stop order is triggered, the other one will be canceled.

As you can see from the candlestick chart above, the price fell below the signal bar and triggered the sell order. It gave us a solid day trade that captured most of the day’s range.

If the price action context is not trending, you might want to consider taking small profits instead of letting profits run.

Day Trading With ADX Indicator Is Possible (And Profitable)

In essence, the 2-period ADX indicator is a powerful tool to find high probability break-out trades.

The 2-period ADX indicator searches for the ideal low-risk entry point for day trading strategies.

It is a simple tool that you can easily integrate with your day trading setups.

Add it into your day trading strategy as a timing device, or use it as a scalping trade setup. You will be pleasantly surprised.

Learn: Trend Trading Strategy Using The 2-Period ADX Indicator

Read: The Secret To Using ADX Indicator

If you like the idea of using fast indicators, you will love the 2-period RSI.

Read more about ADX, Day Trading

If Trading Setups Review has helped you trade better, please support us on Ko-fi.

Support me on Ko-fi

Thank you for being awesome.

You can also check out other ways to support us here.

Or, please continue exploring what we have to offer…

5 Steps to Surviving Losing Streaks in Active Trading

Template for a Simple Day Trading Strategy

How To Lay A Solid Foundation For Price Action Trading

Bulkowski’s Retrace Day Trading Setup

Learning Guide For Trading With Volume Analysis

Comments

  1. Total Spread Betting says

    July 29, 2015 at 1:49 PM

    I trade using ADX and DMi almost as a complete strategy. I have never used such a short period for the ADX but I am just adding it to some charts now and I can see this looks like it would work really well to confirm entry points. I am also going to look at the high values to see if this gives an indication of the end of the trend. Thanks for sharing the arricle!!!

    Reply
    • Galen Woods says

      July 30, 2015 at 9:52 AM

      Hi, thanks for the comment. Looking at high values to exit the trade is a good approach for scalping, but tends to cut the profit short.

      Reply
  2. pete says

    March 5, 2016 at 3:47 PM

    Is the 2 period ADX better than the 2 Period RSI? When you suggest to close the trade? Can the rsi2 or adx2 may be used to trade both futures abd equity?
    thankd

    Reply
    • Galen Woods says

      March 8, 2016 at 8:09 AM

      You can use them on both futures and equity. But of course, it depends on your overall trading approach. You can refer to this for ideas on how to close a trade.

      Reply
  3. GBN says

    October 9, 2017 at 5:20 PM

    Hi Galen
    I read this strategy with great interest and checked on my crude oil chart (in india). looks promising. however, there are times when the 2 period ADX remains below 25 for sometime before rising above 25.. so wondering if the trade entry should be taken once it goes below 25 or goes above 25?
    Another thing is sometimes i get a false trade, which means, after touching 25 and reversing, the trade does not last long. any filter mechanism you can suggest?
    many thanks

    Reply
    • Galen Woods says

      October 13, 2017 at 11:19 AM

      It’s best to use the ADX dipping below 25 as a signal to consider a breakout trade. The breakout trade should be based on a price pattern, like an inside bar or a congestion area. In this sense, you are not trading the indicator, but the underlying price pattern. You can try to stick with the trend for the breakout direction. A way to get a better R:R is also to fade a breakout against the trend.

      Reply
  4. Jinen Shah says

    January 11, 2018 at 3:57 PM

    would you please suggest whether to use adx on the time frame on which the trade is taken or on the carts that you are actually analysing the trend… To explain further I generally use the daily chart or weekly chart to analyse the trend and take the trade based on 4 hourly chart (swing trade). Similarly i analyse the daily and 1 hour chart for trend and take the trade from 15 mins chart (intraday trade).

    Awaiting your valuable advice.

    Reply
    • Galen Woods says

      January 16, 2018 at 6:48 PM

      This particular application uses ADX as a timing device to enter the market. Hence, it’s advisable to use it on the smaller time frame in which you execute your trades.

      Reply
  5. Mike says

    October 25, 2020 at 6:13 AM

    Reading this and the Holy Grail, would it make sense to call it an entry point if the ADX2 dips below 25 and the ADX14 (or ADX20) is above 30 with an upward movement? Those would happen simultaneously to confirm a strong setup? Thanks

    Reply
    • Galen Woods says

      October 26, 2020 at 11:58 AM

      Hi Mike, that’s an interesting idea. I haven’t examined that approach in-depth, but I’m sure it’s worth a closer study. (But I suspect the ADX14 filter will reduce the number of viable trades by quite a bit.)

      Reply

Leave a Reply Cancel reply

Your email address will not be published. Required fields are marked *

Trading Course Banner

Search Trading Setups Review

Recommended For You

How To Analyze Price Momentum With Micro Channel Trend Lines

Instantly Improve Your Trading Strategy with Support and Resistance

How To Identify Demand and Supply Using Price Action

How To Trade Reversals With The 1-2-3 Price Pattern Setup

10 Steps To Creating Your First Trading Strategy

What is Stopping Volume in Volume Spread Analysis (VSA)?

6 Steps to Find a Day Trading Strategy That Works

Top Trading Books

Top 10 Volume Trading Books

7 Forex Trading Books To Get You Started

18 Trading Psychology Books To Help You Trade Better

Top 10 Price Action Trading Books

7 Trading Books For Your Library


If Trading Setups Review has helped you trade better, please consider supporting us on Ko-fi.

Support me on Ko-fi

Or, check out other ways to support us here.

Thank you for being awesome.


Get a Free Course Chapter from Galen Woods' Day Trading With Price Action Course [PDF]

Plus, our latest trading guides and tips in right your inbox.

Trading Setups Review

  • Support Us
  • Contact Us
  • About Us
  • Privacy Policy
  • Affiliate Disclaimer
  • Full Risk Disclosure

Learn More

  • Day Trading With Price Action Course
  • TSR Trading Guides
  • Trading Setups
  • Trading Articles
  • Trading Books
  • Site Map

Futures and forex trading contains substantial risk and is not for every investor. An investor could potentially lose all or more than the initial investment. Risk capital is money that can be lost without jeopardizing ones financial security or life style. Only risk capital should be used for trading and only those with sufficient risk capital should consider trading. Past performance is not necessarily indicative of future results.


The website contents are only for educational purposes. All trades are random examples selected to present the trading setups and are not real trades. All trademarks belong to their respective owners. We are not registered with any regulating body that allows us to give financial and investment advice.


Trading Setups Review © 2012–2022

Anti-Climax Pattern - Free Course Chapter

Learn a new powerful price pattern today!

Download for free now.