How To Trade Major Reversals With 50% Retracement Zone
By Galen Woods ‐ 9 min read
Trading a trend reversal can be very highly rewarding if you can control your risk with a well-timed entry. Learn how to do that with retracement zones.
Reversal trading is a high-risk trading approach as you need to spot the exact turning point. Hence, reversal trades make sense only when you expect high rewards—the classic high-risk, high-reward method to taking advantage of market movements.
Reversals, when you pinpoint them, offer huge rewards. But they are hard to get right. Hence, we should focus on limiting risk when we get things wrong.
This tutorial will use a retracement zone to contain our risk in a reversal trading strategy. As you’ll see, the zone is also helpful for timing our entry.
Reversal Trading Step-by-Step
For clarity, we will break down the strategy into three steps with explanatory charts.
- Identify a significant trend
- Identify potential reversals
- Project and adjust retracement zones
Step #1: Identify a significant trend
To target high potential rewards, we should focus on reversals of significant trends. If we catch a major market reversal, we would be in a great position to profit from the emerging trend.
A prime indicator of the dominant trend is the 200-period simple moving average (SMA). Thus, let’s use it here to find trends of interest.
To identify a noteworthy trend, we look for gaps between price action and the 200-period SMA. The litmus test here is if you are not sure, it is not a trend.
The chart below shows a bullish market with most of its price action above the 200 SMA.
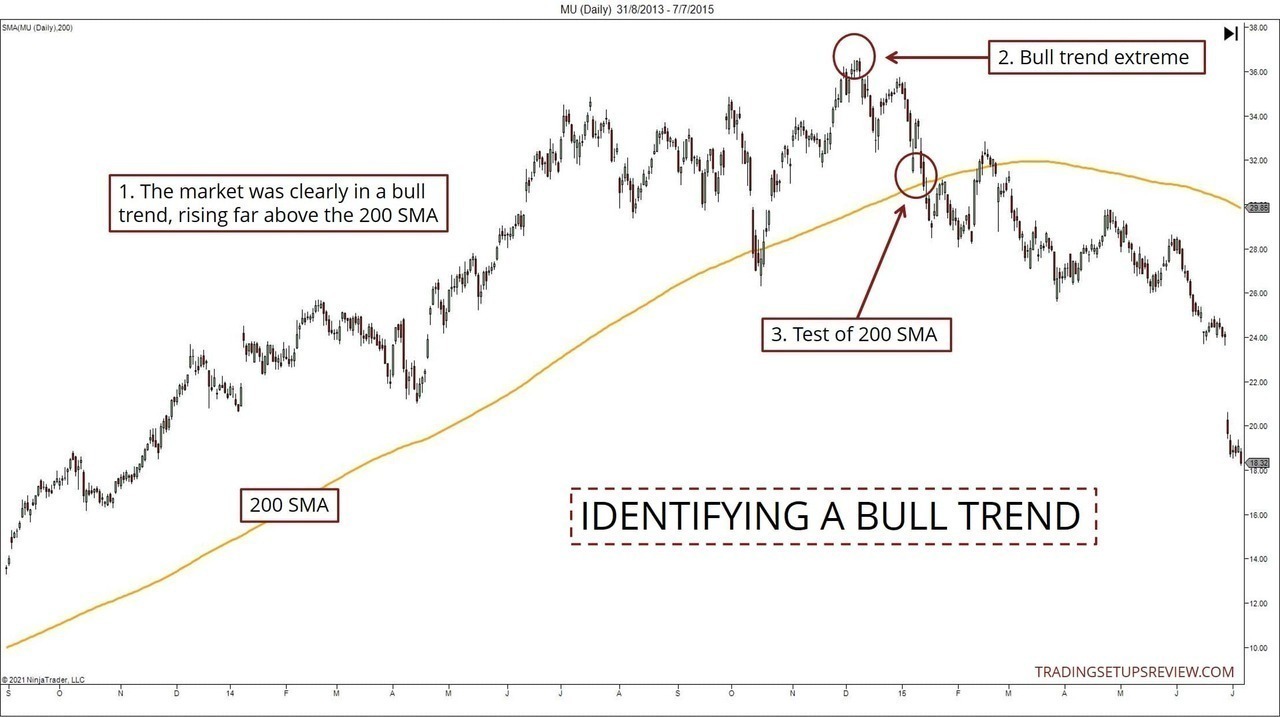
Step #2: Identify potential reversals
After identifying a trend, we look out for clues of a potential reversal.
Here, let’s go with the most straightforward hint - a test of the 200 SMA.
- In a bull trend, if the market pushes down enough to test the 200 SMA, we go on high alert. (This is the situation highlighted in Point #3 in the chart above.)
- In a bear trend, if the market rises sufficiently to test the 200 SMA, we go on high alert.
What does high alert mean?
That’s the next step.
Step #3: Project and adjust the retracement zone
The bull trend testing the 200 SMA is a definite attempt to reverse the trend.
So let’s make use of this attempt to project meaningful retracement zones.
What are retracement zones?
Look at any price chart. You’ll notice a familiar situation.
After a price thrust, the market retraces part of the thrust before pushing further.
This pattern repeats itself and results in the wave-like market structure that we see.
In practice, it’s helpful to measure the retracement as a percentage of the thrust it retraces. (Let’s call this the anchor thrust.)
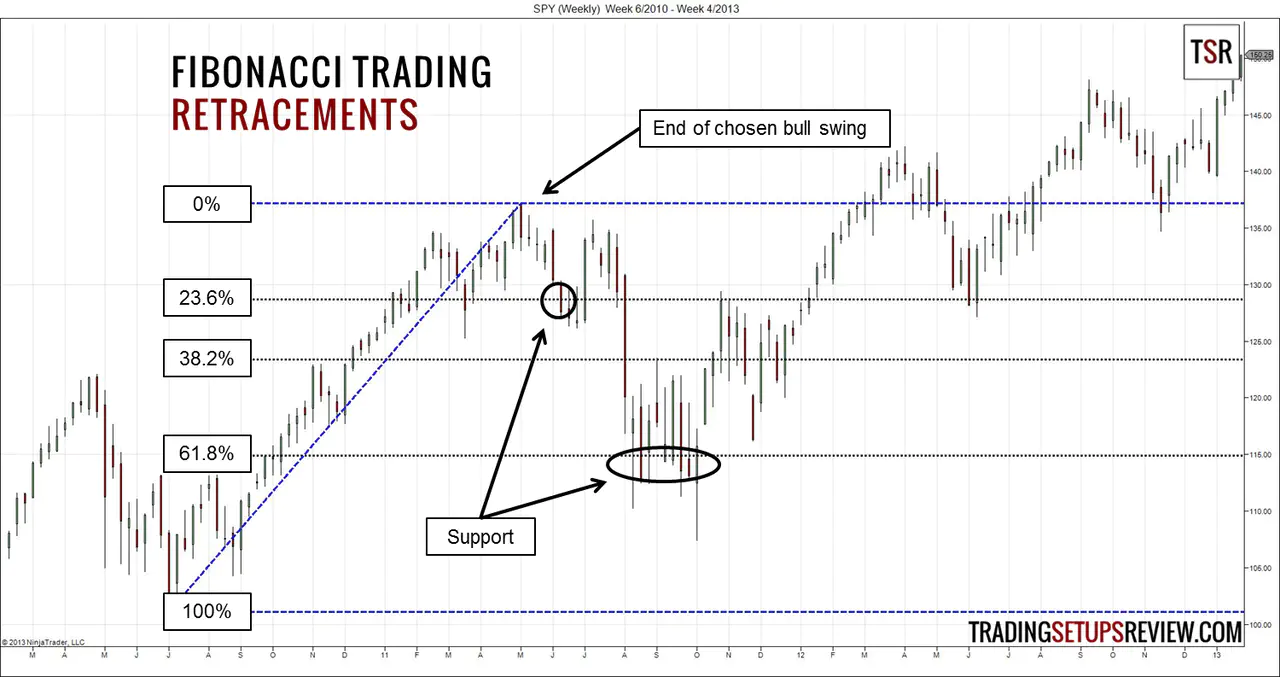
Projecting reliable retracement zones depends on identifying a meaningful anchor thrust (e.g., the blue diagonal line in the chart above).
- The higher the percentage, the more likely that the market is in a range. If the market retraces 100% of the thrust, there is no trend to speak of.
- The lower the ratio, the more likely that a strong trend is in place.
Here, we use the 50% – 61.8% retracement levels to form a support and resistance zone to inform our entries.
There is nothing magical about these precise levels. 50% is just a common-sense benchmark to identify moderate (midpoint) pullbacks. And we include a standard Fibonacci level (61.8%) to form a more accommodating zone to perform our analysis.
The first step to projecting a retracement zone is to identify the anchor thrust.
Here, we will use the push from the trend extreme to the 200 SMA as our anchor thrust.
Not sure what we mean? Let’s go back to our example in the chart below. It enlarges the right half of the earlier chart.
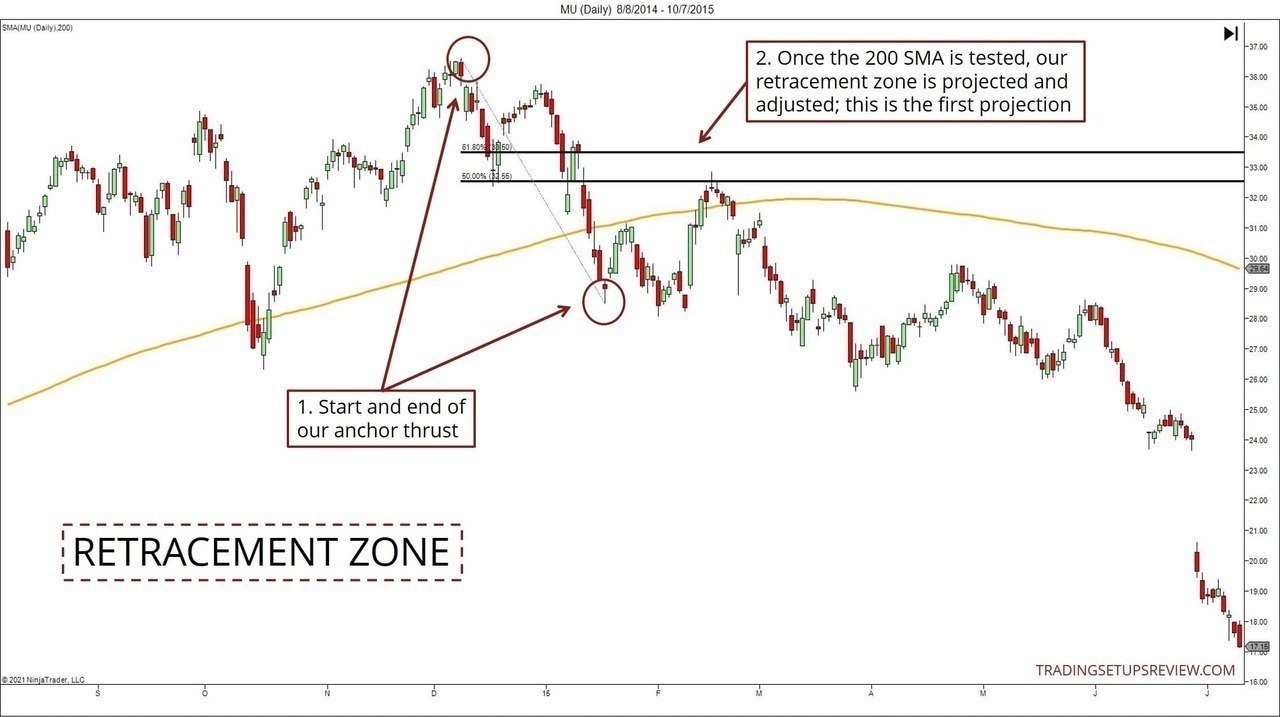
Why are we using this down-thrust as our anchor thrust?
If the expected bear trend materializes, this down-thrust will be the first thrust of this new bear trend. Hence, it offers a significant swing for projecting retracement zones.
Another important note is that we must adjust the projection as the thrust extends. The adjustment will follow each bar that pushes to a new low. While the start of the anchor thrust is fixed, its endpoint shifts as the market pushes down.
The chart below shows the final adjusted zone before the market rose to test its efficacy as a resistance.
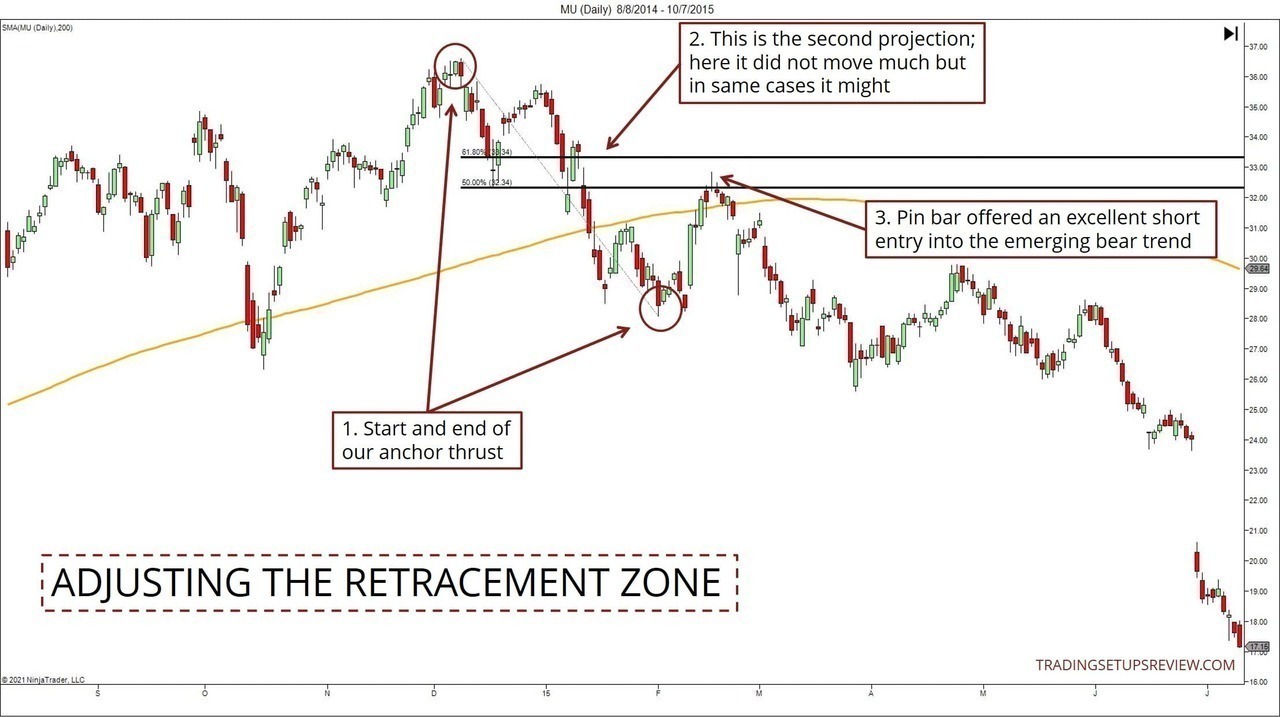
In some cases, adjusting the zone could push the zone below the 200 SMA. If that happens, we skip the setup. Likely, the reversal has already taken off, and we have missed the boat. (Trend retracement setups would be more appropriate then.)
Retracement is a crucial idea in Elliot Wave theory and Fibonacci trading concepts. While they are not our focus here, you can look them up to dive deeper into using retracements.
(You might be staring at the chart above and thinking, how about the earlier test of the 200 SMA? Why are we not talking about that? Don’t worry; we will return to it in Example #4 below.)
Reversal Trading Examples
With any trading method, however well-defined, each trade will play out differently.
Hence, reviewing examples is one of the best ways to understand a strategy thoroughly.
Trading Example #1: Bear Trend Reversing Into A Bullish Market
This chart shows a textbook example of this method, and you must recognize that many trades might not be as ideal. But it does illustrate the incredible reward-to-risk ratio when you get it right.
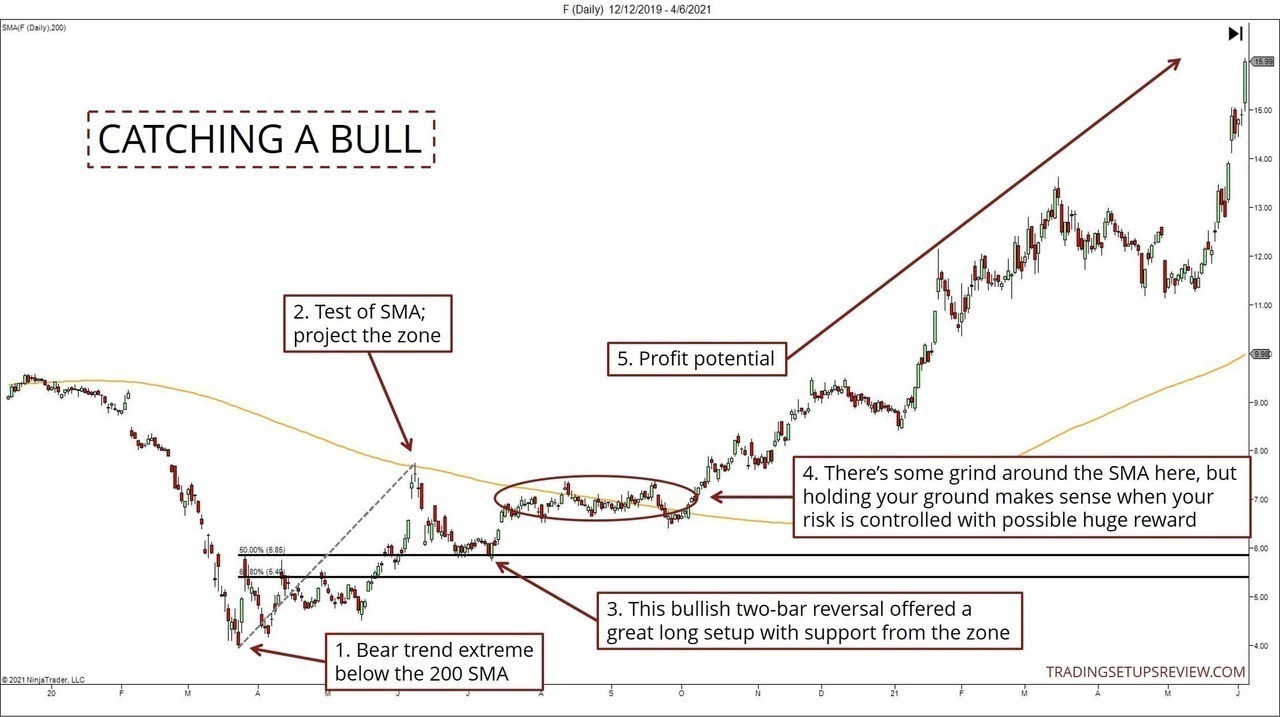
- This is the extreme low of the bear trend before the market rose to test the 200 SMA.
- This test of the SMA established the anchor thrust for our projecting the retracement zone.
- The market found clear support around the 50% retracement level. Not only that, this excellent two-bar reversal pattern helped with controlling our risk. (Stop-loss below the pattern.)
- Shortly after the entry pattern, the market went sideways for a prolonged period. However, given our limited risk and the potential of a new bull trend, it was reasonable to hold our ground.
- In this case, the market eventually conformed to our expectations and took off.
Trading Example #2: Two Valid Bullish Entries
This example shows two valid entries within the retracement zone.
The first one failed, while the second one caught a bullish run with minimal risk.
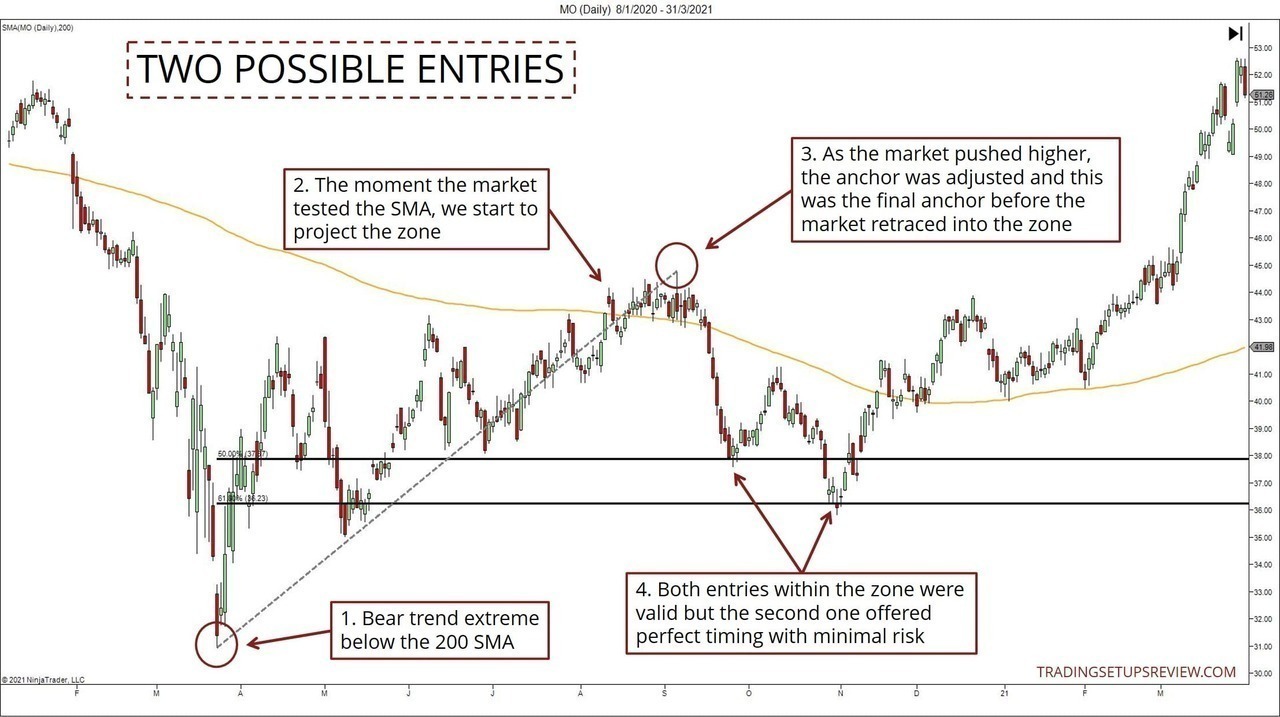
- This point was the extreme of the bear trend before the market rose to test the 200 SMA.
- The moment the market tested the moving average, we started projecting the 50% retracement zone.
- Then, as the market continued higher, we adjusted the projection accordingly. Such adjustments result in thicker retracement zones at higher price levels. This point anchored our final adjustment before the market fell to test the zone.
- The market first bounced off the 50% line and then the 61.8% line. These bounces created two valid entries. Assuming the use of a pattern stop, the market stopped out the first entry unless you used a conservative target. On the other hand, the second entry offered near-perfect timing to go long with minimal risk.
Such scenarios are common. Hence, when using this method, be prepared to re-enter your position if necessary.
Trading Example #3: Reversals Might Not Always Follow
This method we are discussing is not perfect and might not always lead us into trend reversals. Nonetheless, the zones can still offer valuable references for price analysis.
The chart below shows two zones that acted as support and resistance levels.
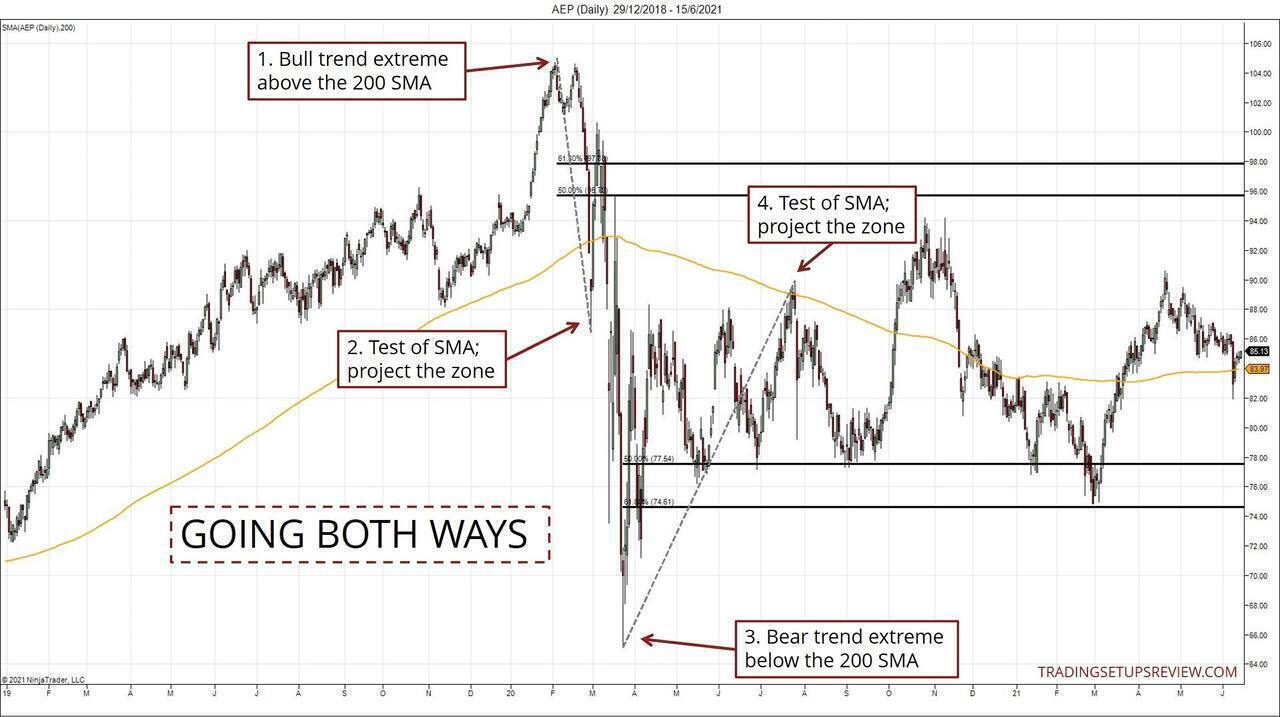
- This point was the apex of the bull trend before it fell to test the 200 SMA.
- After the test of the SMA, we could project the retracement zone as shown.
- This point was the lowest of the dramatic plunge before the market rose to test the 200 SMA.
- With the test of the SMA, we could project the second retracement zone as shown.
Now, let’s zoom into each zone separately to examine the price action in detail.
This chart shows the first retracement zone.
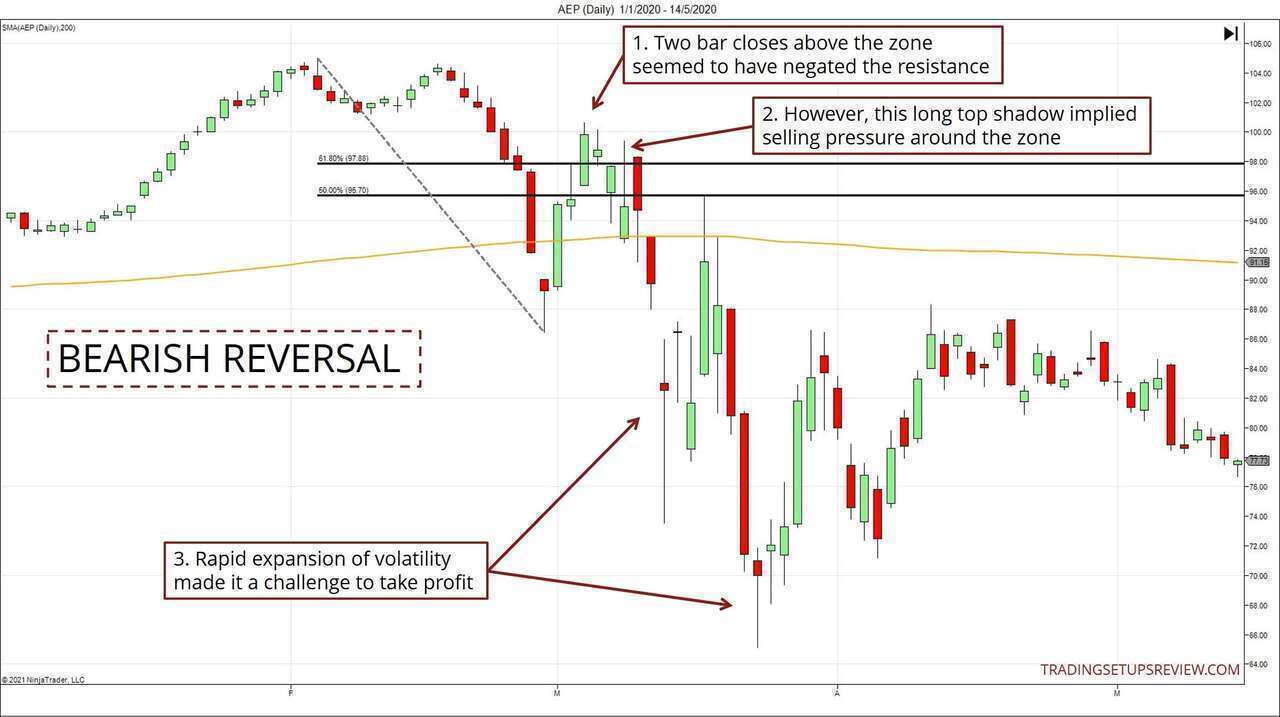
- These two bar closes above the zone suggested that the resistance was failing.
- However, this long top shadow stood out. It clearly hinted at selling pressure around the retracement zone.
- The rapid expansion of volatility made it a challenge to decide on profit-taking.
Overall, the retracement zone was effective. However, finding exact entry and exit points could be challenging. In such cases, zooming down to intraday timeframes might help to finetune our entries.
This chart shows the second retracement zone, projected from an upward thrust towards the 200 SMA.
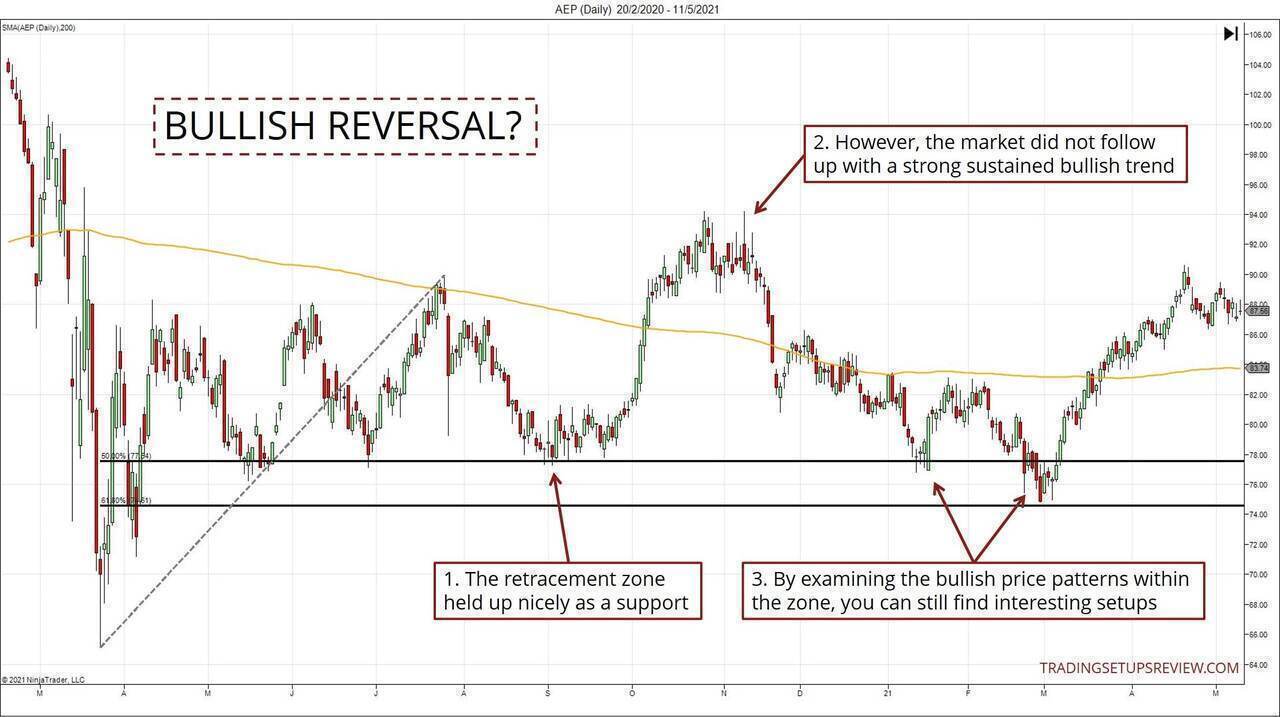
- The retracement zone held up nicely as a support level.
- However, the market did not begin a full-fledged bull trend above the 200 SMA.
- Instead, the market fell back into the projected zone again. Although a new bull trend did not materialize, the projected area was helpful as a support zone. By examining the price patterns within, it was possible to find trading opportunities.
Trading Example #4: Busted Retracement Zone
This example shows how this approach might not work out.
A sound trading strategy should include an invalidation method - a systematic way to decide when to give up on the setup.
In this strategy, when the retracement zone fails, we give up.
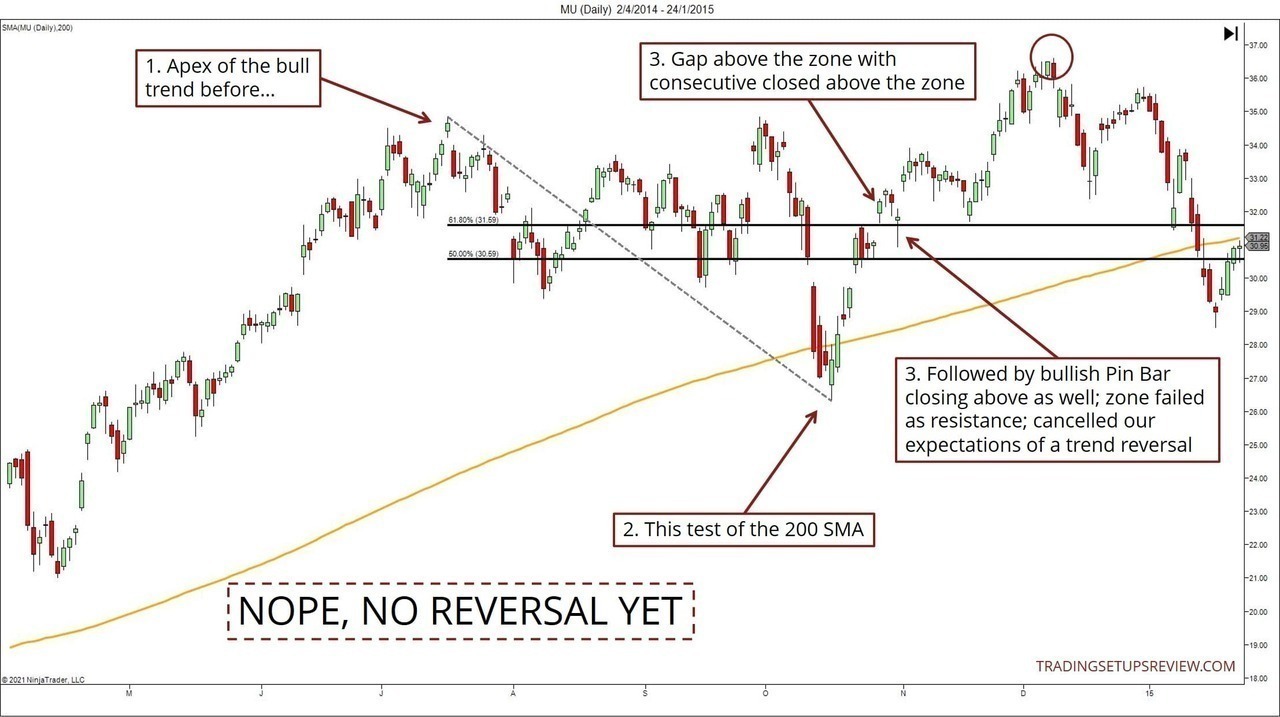
- This point was the apex of the bull trend before it fell to test the 200 SMA.
- With the test of the moving average, we projected the retracement zone. Ideally, we expected the area to resist any bullish thrust and enable our entry into a new bear trend.
- However, the market gapped above the zone and sustained a series of bar closes above it.
- Finally, this bullish Pin Bar sealed the fate of our zone, smashing our hopes of it being a resistance zone. At this point, we stopped looking for a trend reversal.
But soon, we got another reversal setup opportunity. See the circle at the top right corner of the chart?
That is the anchor we used in our step-by-step explanation at the beginning of this tutorial. The zone projected with the down-thrust starting from that point proved to be more helpful for a reversal trade.
Conclusion - Reversal Trading With Retracement Zones
If you are familiar with projecting retracement levels, this reversal strategy is straightforward. It is simply about using the 200 SMA to identify suitable thrusts as a basis for projecting the levels.
We then use the projected levels to assess the market’s attempt to resume the original trend. If the price action cannot even get past the 50% zone, it’s unlikely that the market will maintain the current trend.
With this approach, you might miss many stunning reversals. However, if you are patient, you will be able to take part in some major reversals with a solid system to limit your risk.
While this method usually leaves plenty of room for profit-taking, it is still sensible to have a plan. Check out this guide for some ideas.