9 Technical Analysis Lessons You Can Learn From Academics Backed By Statistics
By Galen Woods ‐ 7 min read
Make technical analysis work for you using insights from sound academic research. Improve your trading with knowledge from statistical research.
Academics do not talk much about technical analysis. They either remain silent on the subject or mainly claim that it’s voodoo.
A college student will learn fundamental analysis over a few modules. But technical analysis is just embedded in the footnotes. Yet, all market traders know what is technical analysis, whether they use it or not.
That has intrigued a minority in the academia to conduct statistical research on technical trading. Here, we focus on what they have for us.
These nine lessons summarise their conclusions on technical analysis. You can use them as a shortcut to understanding what works in technical analysis.
There’s a caveat of course - the statistical methods they use are beyond most of us. Unless you majored in a statistical subject, you’ll need a faith of leap here.
You should know that I do not completely understand the statistics used in the papers below. What I am doing here is to draw on their main conclusions and applying them to practical trading.
Lesson 1: Volume is important
In “Market Statistics and Technical Analysis: The Role of Volume”, the authors showed:
… how volume, information precision, and price movements relate, and demonstrate how sequences of volume and prices can be informative. We also show that traders who use information contained in market statistics do better than traders who do not.
This means that volume is important to traders. (Dr. Brett Steenbarger agrees.)
But what it highlights here is that “sequences of volume and prices can be informative”. This is precisely what volume spread analysis seeks to exploit.
If you’ve not been paying attention to volume, it’s time to start.
Lesson 2: How professionals use technical analysis
In “The use of technical analysis in the foreign exchange market”, the authors surveyed London’s chief foreign exchange dealers.

There are three main takeaways.
- Most of the professional dealers consider technical analysis in forming their market view.
- They pay more attention to technical analysis for shorter time frames.
- They view fundamental and technical analysis as complementary.
Based on their findings, it is sensible to combine technical and fundamental analysis.
However, you should weight them according to your trading time frame. On short intraday time frames, technical analysis should take the lead. For long term investing, fundamental analysis is the key. And there’s a long spectrum in between for potential synergy.
This paper “Effects of time horizon and asset condition on the profitability of technical trading rules” supports the case for technical trading within short time horizons:
Several strategies were demonstrated to have consistently better risk-to-reward ratios under specific asset conditions and short time horizons.
Lesson 3: Combine different indicators for a sound approach
In “The CRISMA trading system: Who says technical analysis can’t beat the market?” (and a follow-up paper), the authors concluded that the CRISMA system outperformed the market.
The CRISMA system has three components:
- Cumulative volume
- Relative strength compared to S&P 500
- 50-day and 200-day moving averages
The main idea of the CRISMA system is to use these three types of indicators to confirm upward momentum in a stock.
Once a mechanical trading idea is published, it’s likely to stop working. However, we can still learn from this system.
The three components hold informational value of different nature. The moving averages depend on price action. The relative strength takes the whole market into account. And there’s volume.
Three indicators that are different from one another. This highlights the key learning point here - combine varied indicators for a robust system.
With a paper title like that, it’s hard not to attract detractors. If you are thinking of using the CRISMA system as your trading template, you should get a balanced view.
Here are some more CRISMA papers for your reference.
- Is the CRISMA technical trading system profitable?
- Profitability of the CRISMA System: From World Indices to the Hong Kong Stock Market
- Testing the CRISMA trading system: evidence from the UK market
Lesson 4: Employ inter-market analysis for forecasting
In a 1995 paper “The profitability of technical trading rules in the Asian stock markets”, the authors find that:
technical signals emitted by U.S. markets have substantial forecast power for Asian stock returns beyond that of own-market signals.
It has been twenty years since this paper was published. Hence, one caveat here is of course that the global markets might have changed.
Nonetheless, the general takeaway is to derive trading ideas from inter-market analysis. Observe the relationship among different markets and exploit it for profit.

To learn more about inter-market analysis, check out these books:
- Trading with Intermarket Analysis: A Visual Approach to Beating the Financial Markets Using Exchange-Traded Fund
- Intermarket Technical Analysis: Trading Strategies for the Global Stock, Bond, Commodity, and Currency Markets
- Intermarket Analysis and Investing: Integrating Economic, Fundamental, and Technical Trends
Lesson 5: Study three-day candlestick patterns
A more recent paper “Can Anomalies Be Explained By Technical Analysis? Evidence From Candlestick Patterns” suggests that candlestick patterns produce good results even after transaction costs.
Specifically, the authors tested three-day candlestick patterns in the Taiwanese equity markets.
Learn more about candlestick patterns here.
Take note that many studies suggest that Asian markets work better with technical analysis. Hence, be careful when applying the same techniques to more developed markets.
Lesson 6: Technical analysis in FX markets
In “Technical trading: Is it still beating the foreign exchange market?”, the authors did a large scale testing of technical trading rules in the FX market.
They examined 45 years of daily data of 30 currencies with over 21,000 trading rules.
In some periods, there is substantial evidence that technical analysis works. This is consistent with the Adaptive Market Hypothesis proposed by Dr. Andrew Lo.
This is another paper with similar conclusions.
For forex traders wondering if technical analysis is useful, these studies offer optimism.
Lesson 7: Chart patterns are useful
In “Stock market trading rule based on pattern recognition and technical analysis: Forecasting the DJIA index with intraday data”, the authors used a new definition of the flag chart pattern on intraday data.
They found that the trading rule outperformed the market.
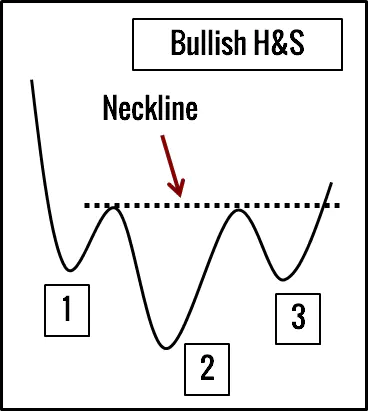
In “Foundations of Technical Analysis: Computational Algorithms, Statistical Inference, and Empirical Implementation”, the authors also found that chart patterns like head & shoulders and double bottoms contain practical value for traders.
Learn more about chart patterns here.
Lesson 8: Volatility aids candlestick pattern trading
In “Trend Definition or Holding Strategy: What Determines the Profitability of Candlestick Technical Trading Strategies?”, the authors commented:
When considering a more volatile market, evidence in favor of candlestick trading strategies is strengthened.
This is why volatility is essential for active technical traders. Consider volatility when choosing your trading market.
Lesson 9: Technical analysis does not work
I use technical analysis in my trading. It goes without saying that I am biased in my selection of the academic papers above.
To offer you a balanced view, here are three papers that do not support technical analysis.
However, consistent with other studies, we find that analysts using technical analysis have not been able to provide recommendations that consistently yield high returns in a short period of time.
Given that technical recommendations follow well-known trading rules and that these recommendations are not associated with future abnormal returns, we conclude that technical analysts do not exhibit ‘artistic’ skills.
Trading System based on the use of technical analysis: A computational experiment
In relation to the passive buy strategy, only the smallest part of the obtained returns outweighs the results of the buy-and-hold strategy.
Conclusion
So far, I’ve presented nine lessons on technical trading.
But be careful when you apply them. Academics with advanced statistical training disagree among themselves as much as traders in online discussions.
No one can tell you who to trust. In your trading, establish your own decision-making process and stick to what makes sense to you.
If you want to read more quality research on technical analysis, I recommend the works of Dr. Andrew Lo.