Kane's Stochastic %K Hooks Day Trading Strategy
By Galen Woods ‐ 3 min read
This S&P day trading strategy from Steve Kane uses price action on a higher time-frame and stochastic %K to find high probability continuation trades.
In Day Trading Systems and Methods, Charles Lebeau, the pioneer of Chandelier exit, introduced this S&P day trading strategy from Steve Kane.
It uses price action at a higher time-frame to find the trend. Then, it uses %K in the stochastic indicator to find a trade entry along with the trend.
Trading Rules - Kane’s %K Hooks
These are the trading rules for this strategy. Note that you will need to set up charts showing two different time frames.
Long Day Trading Strategy
- Hourly bar makes a higher high within the past two hours
- Buy when 12-period slow stochastic %K on 5-minute chart drops below 20 and hooks up
Short Day Trading Strategy
- Hourly bar makes a lower low within the past two hours
- Sell when 12-period slow stochastic %K on 5-minute chart rises above 80 and hooks down
Kane’s %K Hooks Example Trades
Winning Trade - %K Hooks
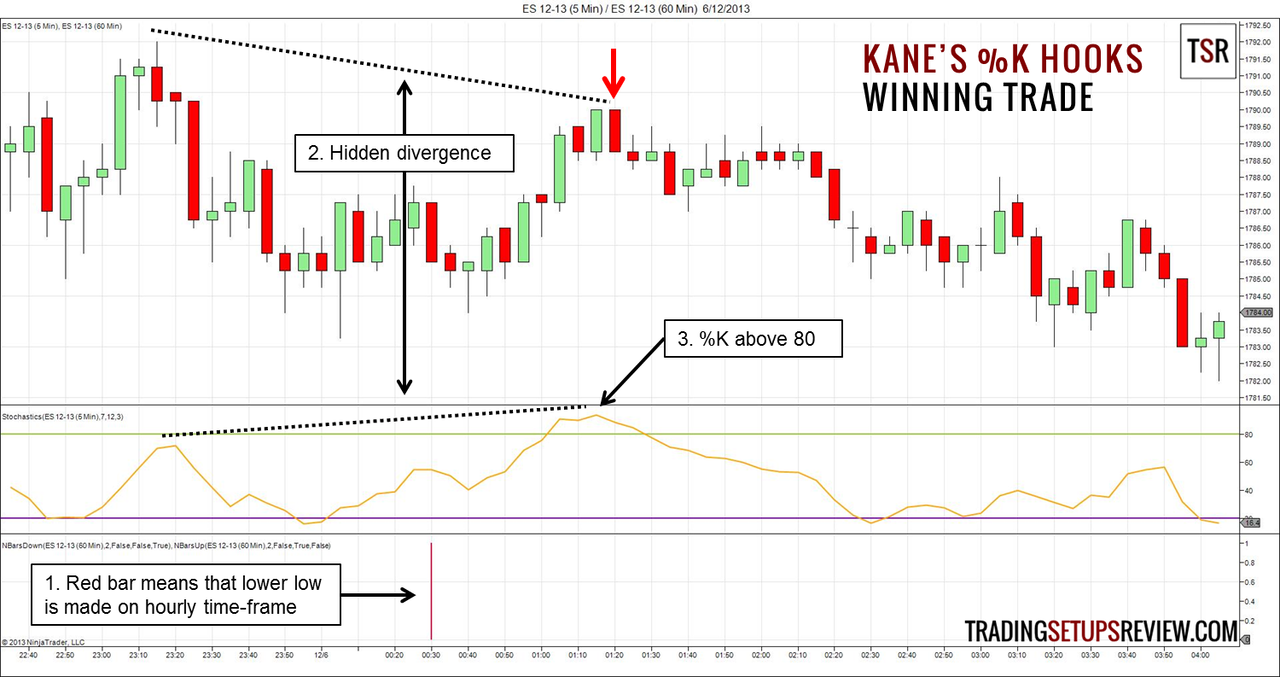
This is a 5-minute ES futures chart. The lowest panel shows a red bar when the hourly bar makes a lower low. It shows a green bar when the hourly bar makes a higher high. The middle panel shows the %K from slow stochastic.
- The hourly bar made a lower low and fired off a down trend signal.
- As stochastic %K made its way up above 80, it made a higher high while price did not. This is a bearish hidden divergence and supports our continuation trade.
- Finally, %K moved above 80. Instead of entering once %K hooked down, we placed sell stop orders below the signal bars. The sell order beneath the second signal bar got triggered. If we exited as %K hooked up from below 20, we would have netted a profit of 2.5 points.
Losing Trade - %K Hooks
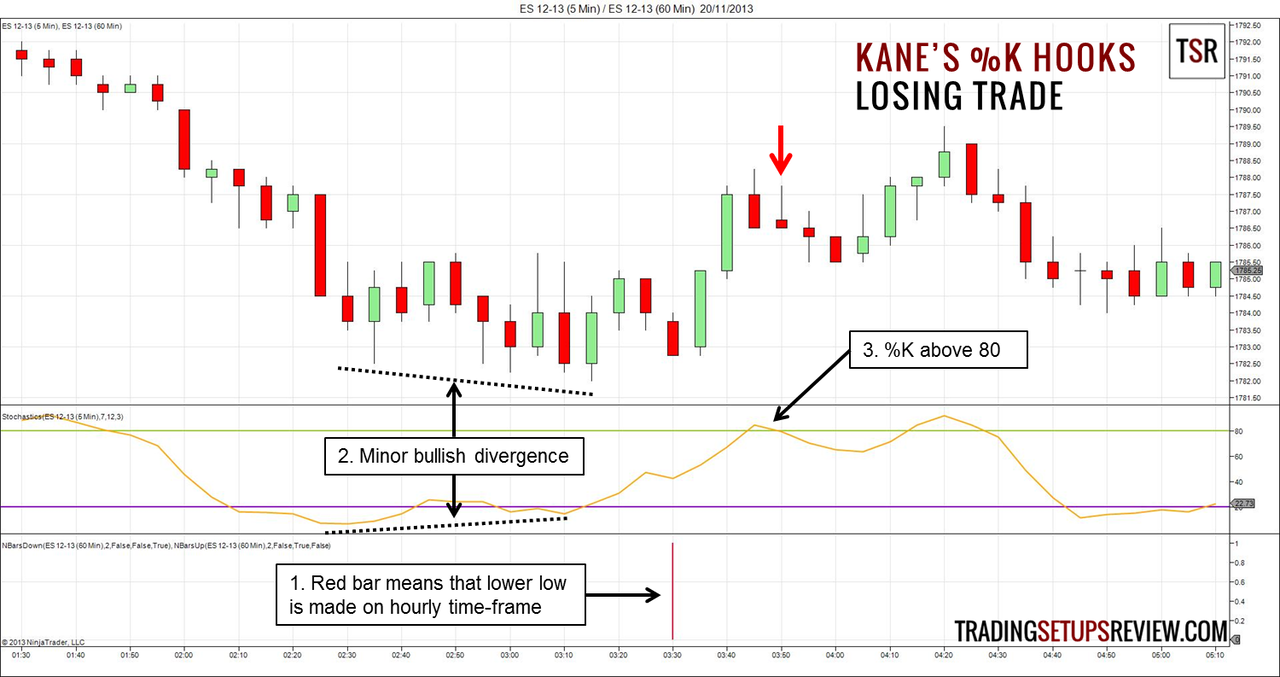
This charts shows another short Kane’s %K Hook day trading setup. However, this trade failed.
- In the afternoon, the hourly chart made a lower low and gave us the go-ahead for short trades.
- However, %K had a bullish divergence with the sideways action at the bottom of the trend.
- Notwithstanding the bullish divergence warning sign, we went short as %K hooked down from above 80. The trade failed within 15 minutes but there was a re-entry opportunity that resulted in a profitable trade. However, I would have avoided the re-entry trade unless there are other confirmations (for e.g. bearish hidden divergence).
Review - Kane’s %K Hooks
This dual time-frame day trading strategy is a sound trading method. However, we should not trade it mechanically.
Looking out for divergences on the stochastic indicator is a convenient way to improve the trading setup.
We can also look out for specific reversal bar patterns when the %K rises above 80 or falls below 20. In some cases, these patterns will allow us to expect a %K hook. At times, when a clear reversal pattern is absent, we can avoid some low-quality trades.
Charles Lebeau recommended two ways to exit the trade. One way is to exit when %K reaches the other extreme. The other way is to look out for divergences on the one-minute time-frame. For more details, you can refer to his book.
If you want to pick up a copy of Charles Lebeau’s book, take note that the settings for day trading systems in the book are outdated. However, some of the trading ideas are timeless. Read the book for its trading ideas but do not follow the settings exactly as it might not work in the current market.
For another multi-timeframe trading strategy, you can refer to the Impulse System by Alexander Elder.