This website or its third-party tools use cookies which are necessary to its functioning and required to improve your experience. By clicking the consent button, you agree to allow the site to use, collect and/or store cookies.
Please click the consent button to view this website.
I accept
Deny cookies Go Back
  • Price Action Trading Course
  • Trading Setups
  • Topics ↓
    • Price Action Trading
    • Day Trading
    • Trader Development
    • Site Map
  • TSR Trading Guides
  • Resources
    • Udemy Trading Course
    • Trading Books
    • Trading Indicators
    • Forex Tester 4
    • NinjaTrader & Kinetick
  • Member Login

Trading Setups Review

Trading Strategies, Guides, and Articles for Active Technical Traders

You are here: Home / Trading Setups / Capture High Profits with Low Volume Pullback Trading Strategy

Capture High Profits with Low Volume Pullback Trading Strategy

By Galen Woods in Trading Setups on February 15, 2014

Dow Theory relies on volume as a secondary indicator to confirm price action. Nonetheless, interpreting market volume has developed into a whole branch of technical analysis (volume spread analysis) and spurred many traders to create volume indicators. In this review, we will focus on trading low volume pullbacks in trends.

Like everything else in trading, absolute values are useless. Rather than “low”, we actually mean “lower”. We look at changes in volume.

When volume increases, traders are interested. When volume decreases, traders are not keen. The market does not move when traders are not interested. So, the idea is to fade low volume moves.

Trading Rules – Low Volume Pullback

Long Trading Setup

  1. Price is above the 20-period simple moving average (SMA)
  2. Price breaks above the last swing high with higher volume
  3. Price falls with lower volume
  4. Buy a tick above the next bullish bar

Short Trading Setup

  1. Price is below the 20-period SMA
  2. Price breaks below the last swing low with higher volume
  3. Price rises with lower volume
  4. Sell a tick below the next bearish bar

Low Volume Pullback Trading Examples

Winning Trade – Short Setup

Low Volume Pullback Trading Strategy - Winning Trade
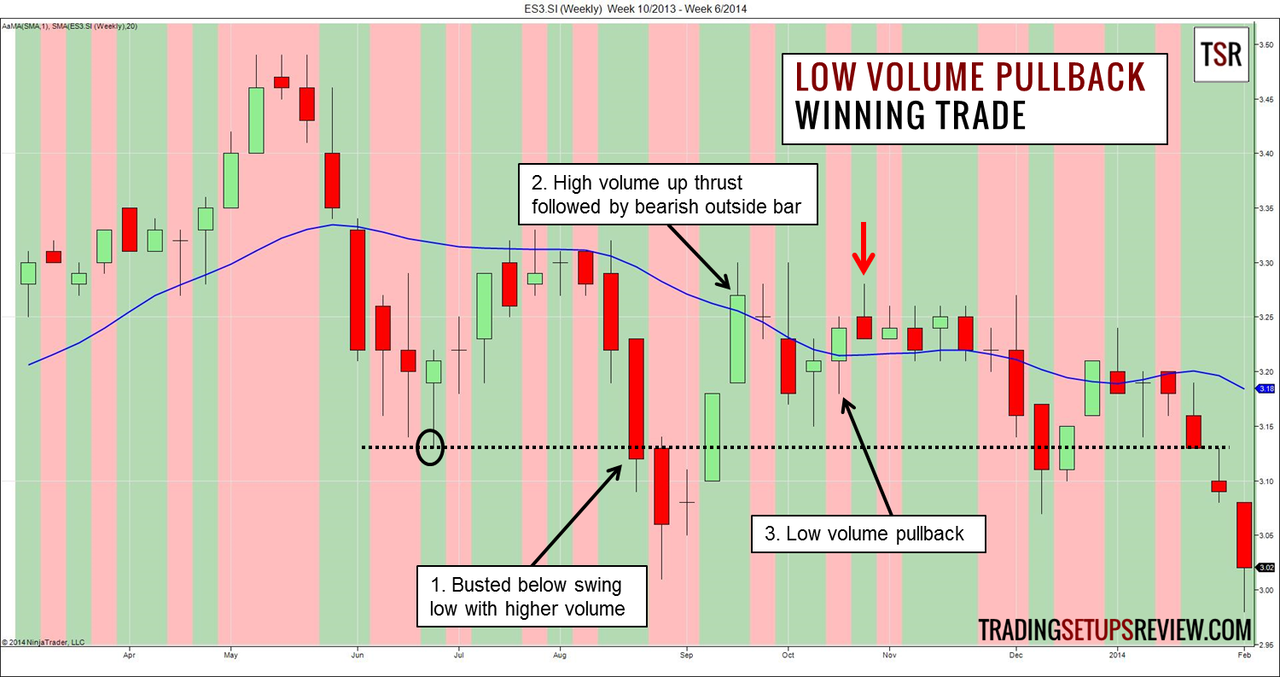
This is a weekly chart of SPDR Straits Times Index ETF (ES3.SI on SGX). It seeks to replicate the performance of the STI which is the main gauge of Singapore’s equity markets.

Volume overlays are great trading tools. They allow you to keep tabs on volume while you look at price action. They mitigate the risk of ignoring price action and focusing only on volume. In this case, green means higher volume than the previous bar, and red means lower volume.

Click here to find out how to get this overlay.

  1. After moving up to test the SMA, price plunged down below the earlier swing low with higher volume (as shown by the green background). It confirmed that bearish momentum was still in place.
  2. As prices pulled back up, it seemed as though we would not have a low volume trading setup. The pullback bars rose up sharply with higher volume. However, the bearish outside bar halted the upthrust and signaled the return of the bears.
  3. Two bars later, we got an up bar with lower volume. It verified the lack of market interest in pushing prices higher. The next bar was a solid bearish reversal bar. We sold a tick below its low.

It took 15 weeks, but this trade proved profitable as the ETF fell to its earlier extreme low.

Losing Trade – Long Setup

Low Volume Pullback Trading Strategy - Losing Trade
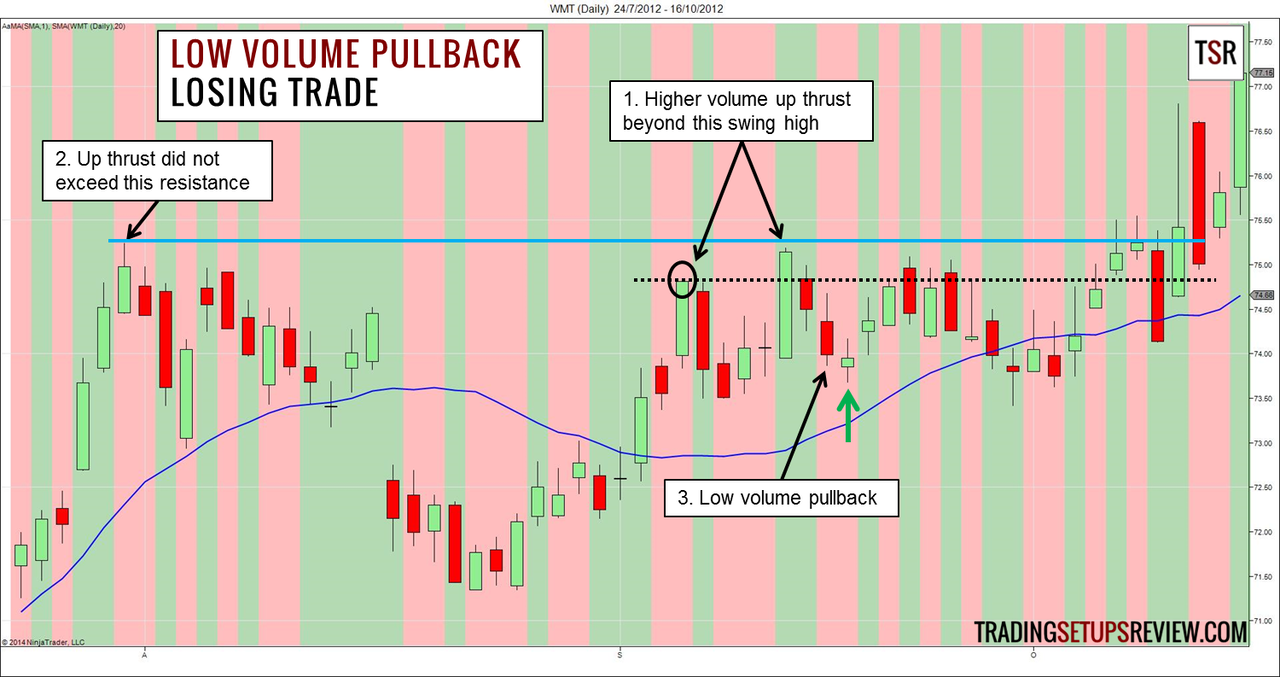
This is a daily chart of Walmart.

  1. Shortly after price moved above the SMA, it made a new high with higher volume.
  2. However, if we extended our perspective, we would have noticed that price failed to rise above a key resistance that sent prices down below the SMA earlier. This failure made the picture less rosy.
  3. We had a low volume pullback followed by a bullish reversal bar. We entered a tick above the reversal bar.

The trade’s maximum profit potential is larger than the amount we risked. However, the trend did not resume until it moved below our signal bar to test our stop-loss level.

Review – Low Volume Pullback Trading Strategy

We used basic volume trading principles directly to create this simple low volume pullback trading strategy.

We looked for increasing volume during break-outs to confirm the market momentum. Then, we took advantage of low volume pullbacks to time when we enter the momentum.

(Like the idea of using volume to confirm trend break-outs? Check out the Yum Yum continuation pattern.)

This trading strategy is extremely useful for clarifying price action. When you can’t tell what price is trying to do, the volume might shed some light.

Paying attention to low volume pullbacks also improves other retracement trading strategies. Combine this low volume approach with the following setups.

  • The Holy Grail
  • Two-Legged Pullbacks
  • 9/30 Trading Setup

Want to learn more about this strategy? Look at my second article on the low volume pullback strategy.

If you want to pick up more ideas about using volume in trading, have fun with these.

  • On-Balance Volume (OBV) Trading Strategy
  • A Complete Guide To Volume Price Analysis
  • Investing with Volume Analysis: Identify, Follow, and Profit from Trends

Read more about Trading Trend, Volume

Serious Traders Only!

Day Trading With Price Action – A complete course that teaches you the art of price action trading.

Perfectly structured with step-by-step guides to help you understand the principles of price action analysis.

Click here for the course syllabus

More From Trading Setups Review

Learning Guide For Trading With Volume Analysis

A Plain and Simple Trend Line Channel Trading Strategy

5 Ways To Fail At Trading

Trading Course Banner

Comments

  1. DemonTrader says

    April 4, 2014 at 2:48 PM

    Excuse me. I dont know what is the indicator that show red and green area ?
    Can I have it ? Thanks

    Reply
    • Galen Woods says

      April 5, 2014 at 9:54 PM

      Hey DemonTrader, check your email. I’ve sent the indicator to you. It’s a pretty simple indicator that just colours the background of the chart according to volume changes. If the volume this bar is higher than the last, it’s green. If not, it’s red.

      Reply
      • DemonTrader says

        April 6, 2014 at 1:59 PM

        Hi Galen Woods. Sr about my bad English.
        I’ve recieve your emaill. Thanks very much.
        And ofcouse I will be like your fanpage, I really like TSR and your write too.
        Finally, Will you write somethings about Harmonic Patterrn or Elliott wave ? I’m looking forward that.

        Reply
  2. ishmeet says

    December 5, 2016 at 3:17 PM

    Sir i got your strategy but how to decide target for the same

    Reply
    • Galen Woods says

      December 8, 2016 at 11:05 AM

      The most conservative target is the last trend extreme. For a long setup, it refers to the highest price point reached before the market started to retrace downwards. You can also consider more ambitious targets using the methods in the article – 10 Ways To Take Profit.

      Reply
  3. ishmeet says

    December 5, 2016 at 3:18 PM

    pls send me the indicator als and can i use it on ninja trader

    Reply
    • Galen Woods says

      December 9, 2016 at 11:27 AM

      Click here to learn more about getting the background color indicator. Follow the instructions for Example 3 to get the volume chart colour.

      Reply

Leave a Reply Cancel reply

Your email address will not be published. Required fields are marked *


Search Trading Setups Review

Get a Free Course Chapter from Galen Woods' Day Trading With Price Action Course [PDF]

Plus, our latest trading guides and tips in right your inbox.

Recommended For You

Beginner’s Guide To Reading Price Action

Volume-Weighted Moving Average (VWMA) – A Simple Volume Tool

A Candlesticks Trading Strategy With Mountains, Rivers, Crows and Soldiers

On-Balance Volume Trading Strategy For Fading Dumb Money

The Holy Grail Trading Setup

Trading Pullbacks Using Trend Lines and Price Channels

The Ultimate Moving Average Trading Guide

Trading Course Banner

Trading Setups Review

  • About Us
  • Contact Us
  • Advertise With Us
  • Privacy Policy
  • Affiliate Disclaimer
  • Full Risk Disclosure

Learn More

  • Day Trading With Price Action Course
  • TSR Trading Guides
  • Trading Setups
  • Trading Articles
  • Trading Books
  • Site Map

Futures and forex trading contains substantial risk and is not for every investor. An investor could potentially lose all or more than the initial investment. Risk capital is money that can be lost without jeopardizing ones financial security or life style. Only risk capital should be used for trading and only those with sufficient risk capital should consider trading. Past performance is not necessarily indicative of future results.


The website contents are only for educational purposes. All trades are random examples selected to present the trading setups and are not real trades. All trademarks belong to their respective owners. We are not registered with any regulating body that allows us to give financial and investment advice.


Trading Setups Review © 2012–2021