Ease of Movement Trading Strategy
By Galen Woods ‐ 4 min read
Ease of Movement combines price action with volume to find the path of least resistance. Use it to confirm a trend before jumping into the market.
Combining price and volume helps us to decipher demand and supply. But what’s the point of understanding demand and supply? We want to find the path of least resistance. For this purpose, Richard Arms’ Ease of Movement indicator fits the bill.
While you can check out Ease of Movement’s formula here, you don’t need to memorize it if you understand the intuition behind it. This is how it works.
For a market to rise, it must overcome overhanging supply. Hence, if a price increase showed heavy volume, it means that supply was abundant. The market had to overcome the supply before rising. In conclusion, the market rise was difficult.
What if the market rose with light volume? This means that there was little overhanging supply that the market had to overcome to rise. Hence, the market rose easily.
Of course, we can also apply the same logic to falling markets. And the result is the Ease of Movement indicator.
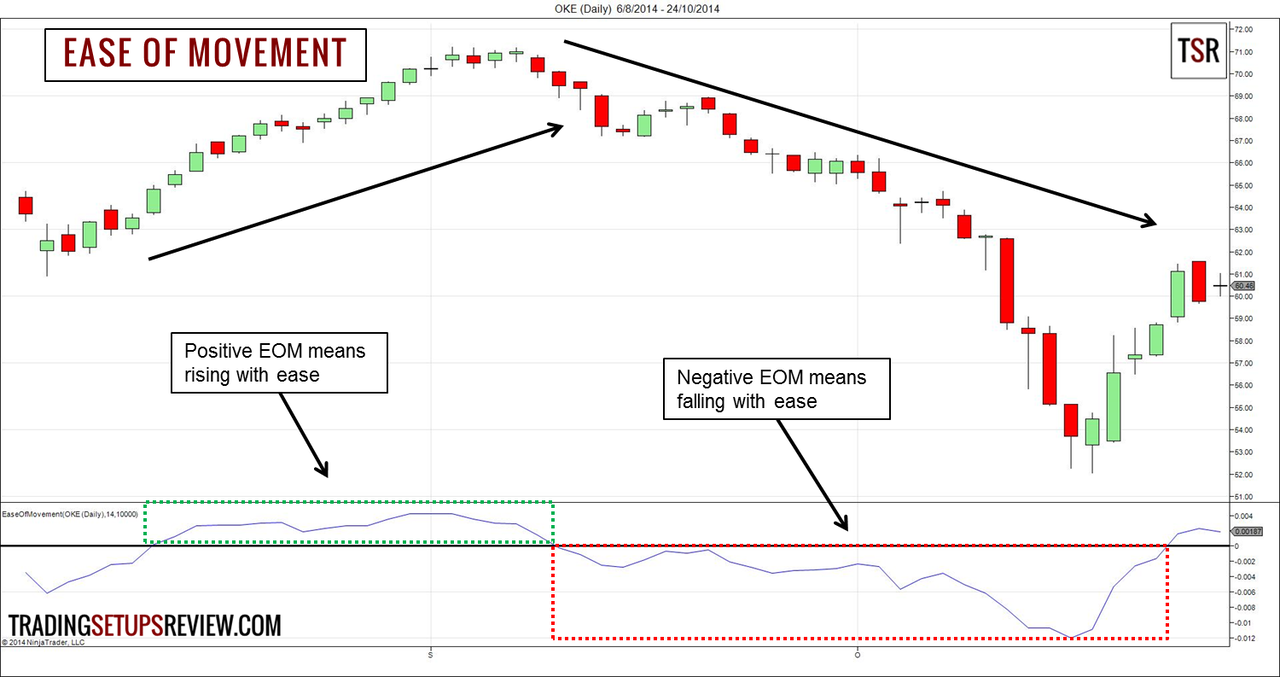
The Ease of Movement indicator has a zero line. Positive values imply that the market is moving higher with ease. Negative values point to an easy decline. The chart below shows an example.
Trading Rules - Ease of Movement
In this strategy, we are looking for trapped traders in a trend. Hence, we will use the Ease of Movement indicator for two purposes.
The first is to confirm a trend. For a bullish trend, we want a sustained positive Ease of Movement together with a rising market. For a bearish trend, we want to see negative Ease of Movement values. (Refer to Trading Rule 1 below.)
Then, we will wait for a pullback against the trend as indicated by the Ease of Movement indicator. This will help us find pockets of trapped counter-trend traders. (Refer to Trading Rule 2 below.)
We are using the common default Ease of Movement settings of 14-period.
Bullish Trend Rules
- Ease of Movement forms a swing low above the zero line.
- Ease of Movement falls below the zero line.
- Buy when price rises above any bullish bar.
Bearish Trend Rules
- Ease of Movement forms a swing high below the zero line.
- Ease of Movement rises above the zero line.
- Sell when price falls below any bearish bar.
Ease of Movement Trading Examples
Winning Trade - CAH Daily
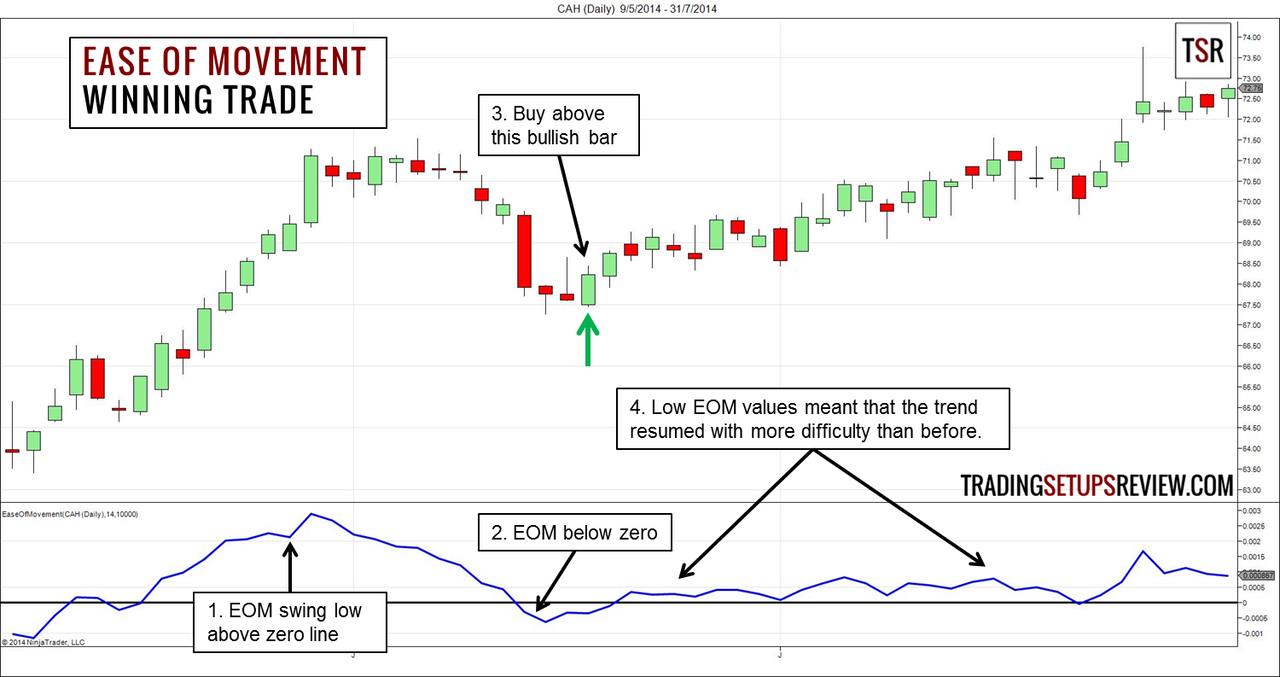
This is a daily chart of Cardinal Health (CAH on NYSE). The lower panel shows the Ease of Movement indicator in blue. Its zero line is in black.
- The Ease of Movement indicator formed a swing low above the zero line, confirming a bullish trend. Note that we were not looking for price swing lows. We were looking for swing lows formed by the Ease of Movement plot.
- As the Ease of Movement became negative, it was a sign that at least some counter-trend traders have taken short positions.
- Assuming that the bullish trend was intact, we wanted to fade the counter-trend traders. Hence, we bought above this bullish bar.
- Although the Ease of Movement indicator turned positive after our long entry, its values remained low. It implied difficulty in the market’s attempt to resume the bullish trend. Hence, it was wise to keep our target conservative.
Losing Trade - AA Daily
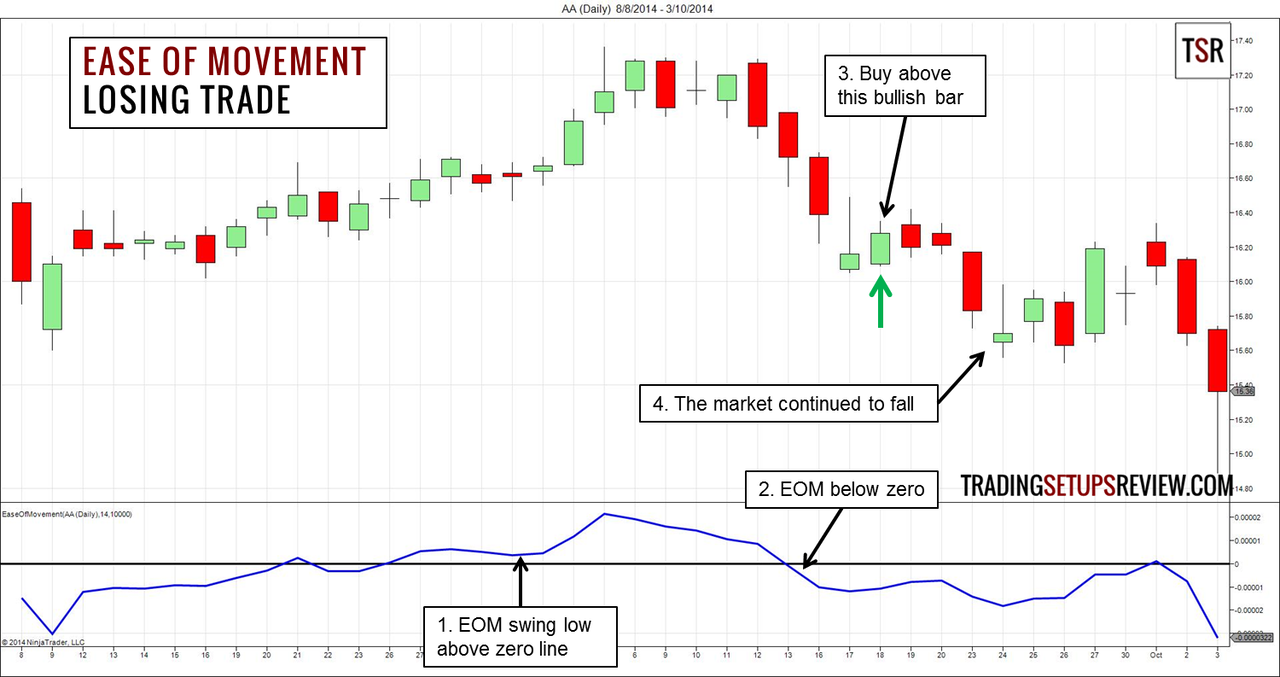
The chart above shows the daily price bars of Alcoa Inc (AA on NYSE).
- The Ease of Movement indicator formed a swing low, sustaining its positive drift. Bullish mode on.
- As the Ease of Movement indicator fell below the zero line, it was time to look for long entries.
- This bullish inside bar was a solid entry bar.
- However, the market continued to fall right after our entry.
Focus on the price action in both examples. The retracement in the winning trade was around half of the earlier bullish swing. In the losing example, the retracement reversed the entire last bull swing.
In the latter, it was likely that the bullish market structure has already been compromised. Hence, the long trade seemed like a bad idea once we take price action into account.
Review - Ease of Movement Trading Strategy
The Ease of Movement is a nifty indicator that accounts for the interaction between price action and volume. If you agree with the logic that links ease of price movement to trading volume, this is indicator is for you.
This trading rules above represent a simple trading setup for educational purpose. Thus, we used the Ease of Movement indicator for both trend identification and entry timing.
However, in fact, Richard Arms did not design this indicator as a complete trading solution. Most traders combine it with other methods or indicators for a more robust analysis. Its greatest value is in confirming other indicators with its intuitive price volume dynamics.
Richard Arms has done extensive research on the relationship between market movement and volume. He is also the pioneer of the unique Equivolume charts.

Overloaded with indicators? Missing out on price patterns? Learn a simple and versatile price pattern to improve your trades.