Swing Trading with Stochastic Oscillator and Candlestick Patterns
By Galen Woods ‐ 4 min read
Learn how to filter out low-quality candlestick patterns with the Stochastic Oscillator to improve your swing trading win rate.
New traders make the mistake of treating candlestick patterns as simple trading signals. They do not realize that most candlestick patterns are defined using the last two to three price bars and ignore the price action context.
Hence, it is crucial to combine candlestick patterns with other methods of analysis. In this swing trading strategy, we will use the Stochastic Oscillator to find high-quality candlestick patterns.
Stochastic Oscillator
There are three types of Stochastic Oscillator: Fast, Slow, and Full. (Learn more about their differences.)
For this setup, we will use the Full Stochastic Indicator. It has three inputs:
- Look-back Period for %K (5)
- %K Smoothing (3)
- %D Moving Average (3)
The Stochastic (5,3,3) setting is sensitive, and hence suitable for finding short-term retracement trades.

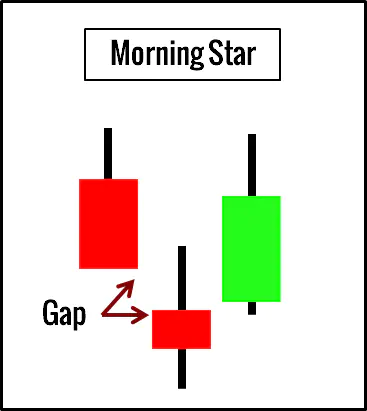
Morning/Evening Star Candlestick Patterns
Gaps are characteristic of daily charts that swing traders use. While gaps pose a risk for swing traders, they reveal precious market clues.
The Morning/Evening Star candlestick patterns take advantage of these “clues”. Thus, we will focus on these patterns in this review. Of course, you can also use the Stochastic Oscillator to confirm other candlestick signals.
Trading Rules - Stochastic with Candlestick Patterns
Long Swing Trade
- Market is trending upwards.
- Stochastic (5,3,3) is below 20. (oversold)
- Buy once a Morning Star candlestick pattern is completed.
Short Swing Trade
- Market is trending downwards.
- Stochastic (5,3,3) is above 80. (overbought)
- Buy once a Evening Star candlestick pattern is completed.
For simplicity, you can use price action and the Stochastic Oscillator to judge the market trend. Refer to the examples below.
Trading Examples - Stochastic with Candlestick Patterns
Winning Trade - SYY Long Swing

This is the daily chart of SYSCO Corporation (SYY on NYSE). The bottom panel shows the Stochastic Oscillator.
- Look at the last two points when the Stochastic was oversold. Compare the price levels. If the more recent oversold point is at a higher price, we are bullish.
- With a bullish view, we looked for Morning Stars. This Morning Star did not occur with an oversold Stochastic reading. Thus, it did not fit our trading rules.
- The second Morning Star had the support of the Stochastic Oscillator and fitted the bill. We went long as the Morning Star completed.
In this example, we managed to skip the losing pattern and take the profitable one with the help of the Stochastic Oscillator.
Losing Trade - INTC Short Swing

The chart above shows the daily price bars of Intel Corporation (INTC on NYSE).
- Look at the last two points when the Stochastic was overbought. Compare the price levels. If the more recent overbought point occurs at a lower price level, we are bearish bias.
- We ignored this Evening Star pattern as the Stochastic Oscillator was not overbought.
- This second Evening Star pattern formed as the Stochastic Oscillator became overbought. Thus, it was a valid bearish setup. However, this setup failed quickly as the market gapped up.
While we managed to filter out the first Evening Star with the Stochastic Oscillator, we could not avoid the second one. This short setup, despite its failure, was reasonable.
One minor factor that might have deterred us from going short was the price gap highlighted by the green box in the chart above. The market has a tendency to rest obvious gaps like this one. Hence, if we held this expectation, we would not have taken the short setup.
Review - Stochastic with Candlestick Patterns
Combining candlestick patterns with technical indicators is a sound approach. Here, we combined an oscillator and a three-bar pattern to find pullback trades.
This trading strategy is not perfect and is certainly not profitable if traded mechanically. However, it offers a solid starting point for both system and discretionary swing traders.
Both the Stochastic Oscillator and candlestick patterns are well-defined. Hence, they are easy to code into market scanning software. For swing traders finding opportunities among hundreds of stocks, this is a huge advantage.
I looked at the Stochastic Oscillator and price action to decipher the trend to avoid adding indicators. You can certainly use other methods to track the market trend. (For e.g. market structure, moving average)
Since you like candlesticks, here’s more for you:
- Candlesticks with Moving Average
- Candlesticks with Pivot Points
- Candlesticks with RSI
- Steve Nison’s Japanese Candlestick Charting Techniques
Confused by complicated patterns? Pick up a simple and effective price pattern to improve your trades.