Volume-Weighted Moving Average (VWMA) - A Simple Volume Tool
By Galen Woods ‐ 8 min read
Learn how to use the Volume-Weighted Moving Average (VWMA) as a simple tool for volume analysis. Enhance your moving average trading strategy now.
Volume analysis might seem esoteric and challenging to master. While volume analysis has great potential, some volume trading indicators, with their many inputs, are hard to understand. This is why the Volume-Weighted Moving Average (VWMA) is a suitable choice for anyone new to volume analysis.
If you are familiar with the Simple Moving Average (SMA), you’re already well-poised to pick up the VWMA as a trading tool.
What is a Volume-Weighted Moving Average?
Compared to indicators like the On-Balance Volume and Ease of Movement, this is a straightforward indicator.
An SMA is an average of the past N closing prices. It gives the same weight to every closing price.
- 3-Day SMA = (C1 + C2 + C3) / 3
A Volume-Weighted Moving Average is the same, except that it gives a different weight to each closing price.
And this weight depends on the volume of that period. For instance, the closing price of a day with high volume will have a greater weight on a daily chart.
- 3-Day VWMA = (C1*V1 + C2*V2 + C3*V3) / (V1+ V2+ V3)
E.g., if the volume of day 3 (V3) is higher, its closing price (C3) will have a more substantial effect on the computed value.
The chart below will help you appreciate the impact of volume weighting.
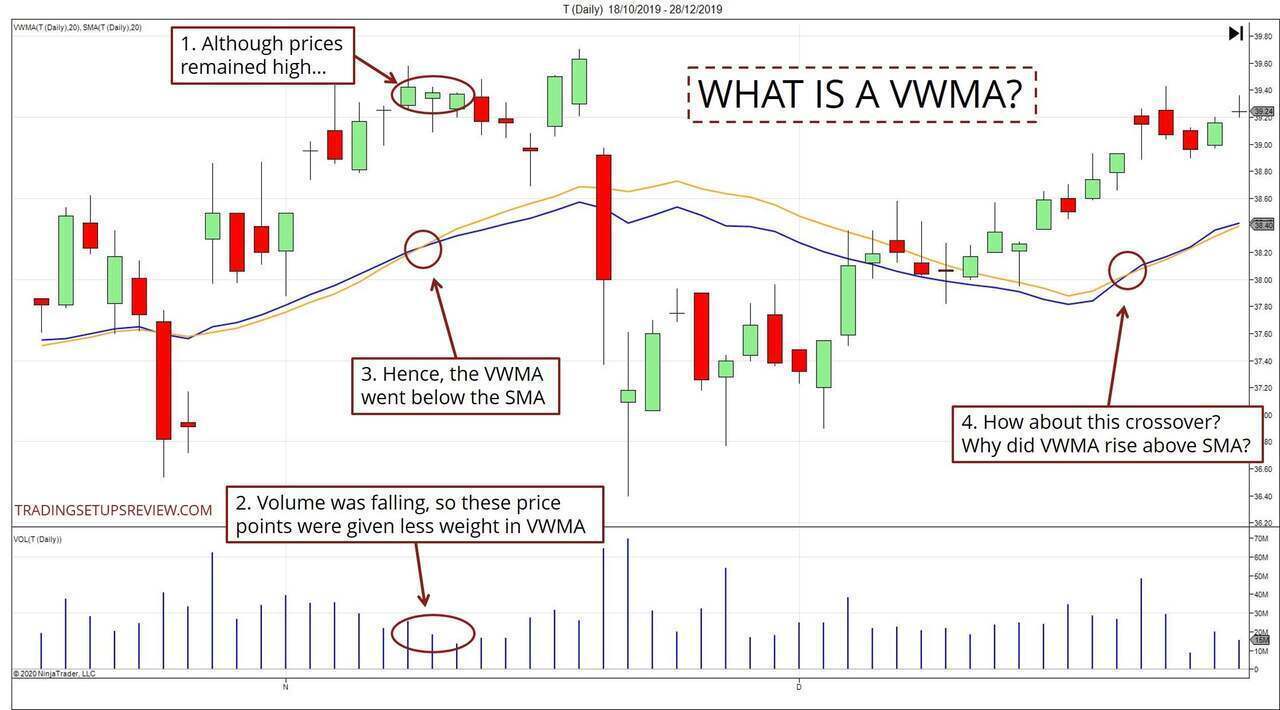
- After a market rise, the closing prices remained high at this point.
- But their volumes were falling. Hence, the VWMA gave these points less weight.
- However, the SMA did not adjust any weights. Hence, although the VWMA continued rising, it did not increase as much as the SMA. This behavior led to the SMA crossing above the VWMA.
- Here, the VWMA crossed above the SMA. Can you figure out why?
How To Use The VWMA?
Now we know what goes into this volume indicator and how it behaves.
Next, let’s think about how to use it to improve our trading decisions.
A moving average is a versatile tool.
You can:
- Use its slope as a trend filter.
- Compare the price to its moving average to decipher momentum.
- Watch the moving average as a support or resistance level.
For a price action trader, these are reliable methods to trade most moving averages, including the SMA and EMA.
But should we deploy the VWMA like a standard moving average?
No.
The tactics above are reasonable for most moving averages. But they miss the point of the VWMA because they do not make use of its unique integration with volume data.
To take full advantage of the VWMA, use it together with an SMA.
Combine VWMA with a Benchmark SMA to Highlight Volume Signals
An SMA does not include volume weighting. Hence, by comparing a VWMA to an SMA, you can immediately decipher the impact of adding volume data.
The SMA is a benchmark. And for it to be a valid benchmark, choose the same look-back period for both the SMA and the VWMA.
By doing so, we ensure that the only difference between the two moving averages is volume weighting.
What matters here is the gap between the VWMA and the SMA. Their difference highlights the effect of volume weighting.
Generally, the volume should increase along with the trend and decrease against it.
- If the VWMA is above the SMA, it means that volume has been higher on up days (days when the market closed higher).
- If the VWMA is below the SMA, it shows that down days saw higher volume.
How To Interpret the VWMA
Let’s go through a few charts to answer this question. They illustrate various ways to interpret the VWMA using the SMA as a benchmark.
In the charts below, the VWMA is blue, and the SMA is orange.
As mentioned, both moving averages must be set to the same look-back period. Here, both are using 20-period as their look-back parameter.
#1: Confirm Trends
This chart shows the FDAX futures contract in a 3-minute chart.
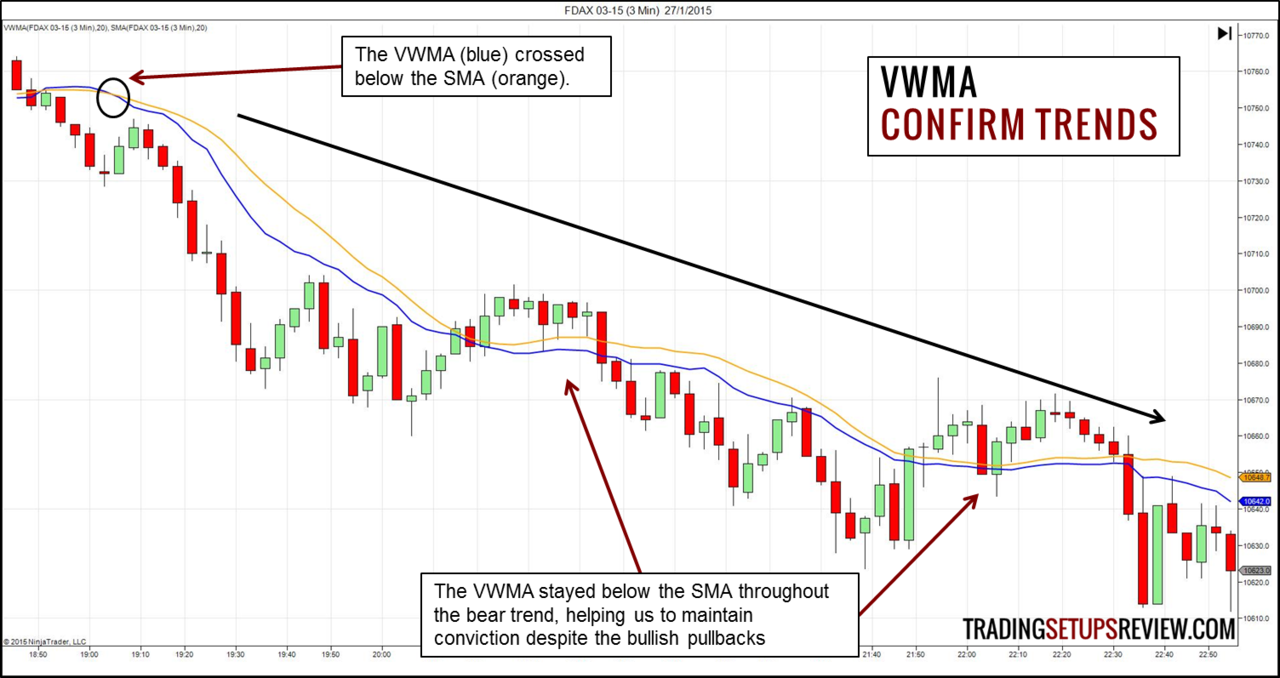
- The blue VWMA crossed below the orange SMA as a bear market began.
- The VWMA stayed below the SMA. This is a sign of a healthy bear trend.
For traders who are trying to let their profits run, this offers a form of assurance.
#2: Find Weakening Trends
This is a daily chart of McDonald’s Corporation (MCD on NYSE).
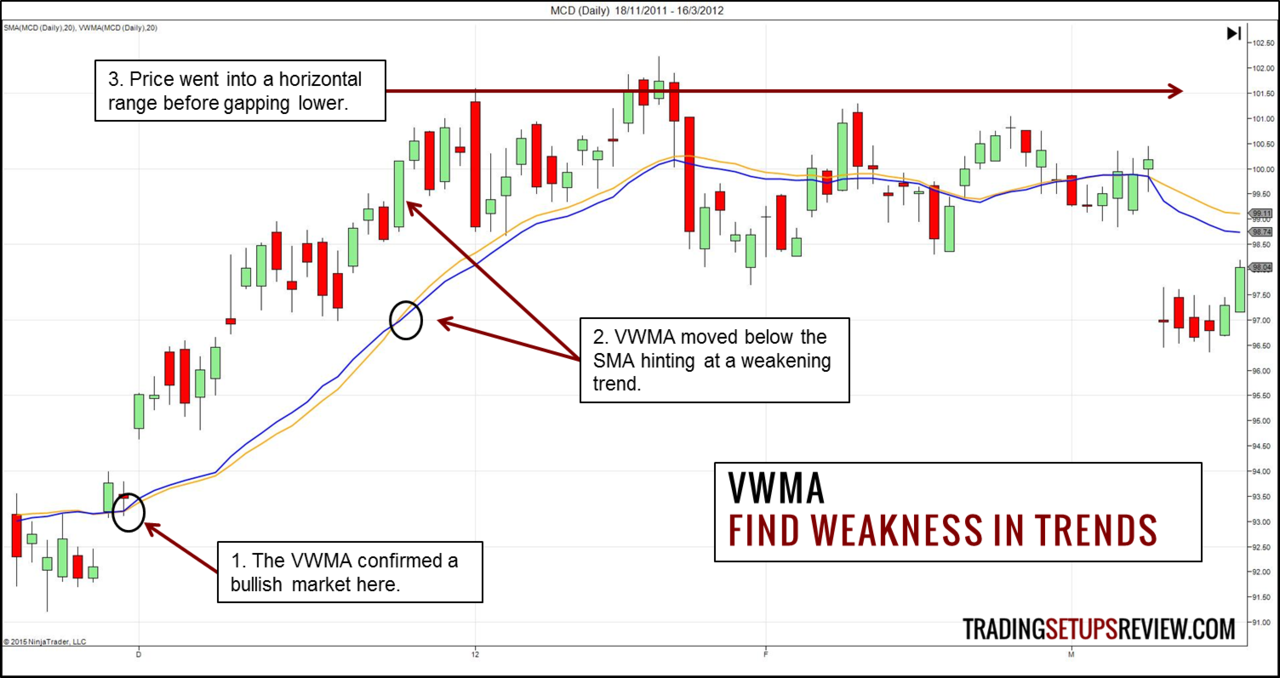
- The VWMA confirmed a bull trend here after a powerful gap up.
- However, at this point, the VWMA went below the SMA. Both moving averages were rising, but their relative position reversed. It was a stark warning that the bullish trend lacked volume support.
- The ominous crossover preceded a period of sideways consolidation. Then, the market gapped down to begin a bear trend.
Most moving averages issue reversal warnings through crossovers. However, as moving averages are lagging indicators, they do only after the market has reversed.
In comparison, here, combining the two moving averages led to an impressive early signal. It managed to warn us while the bull market looked intact, even before the sideways congestion began.
#3: Trade Divergences
This is a daily chart of Textron Inc (TXT on NYSE). It shows how the divergence between price and volume presents a trading opportunity.
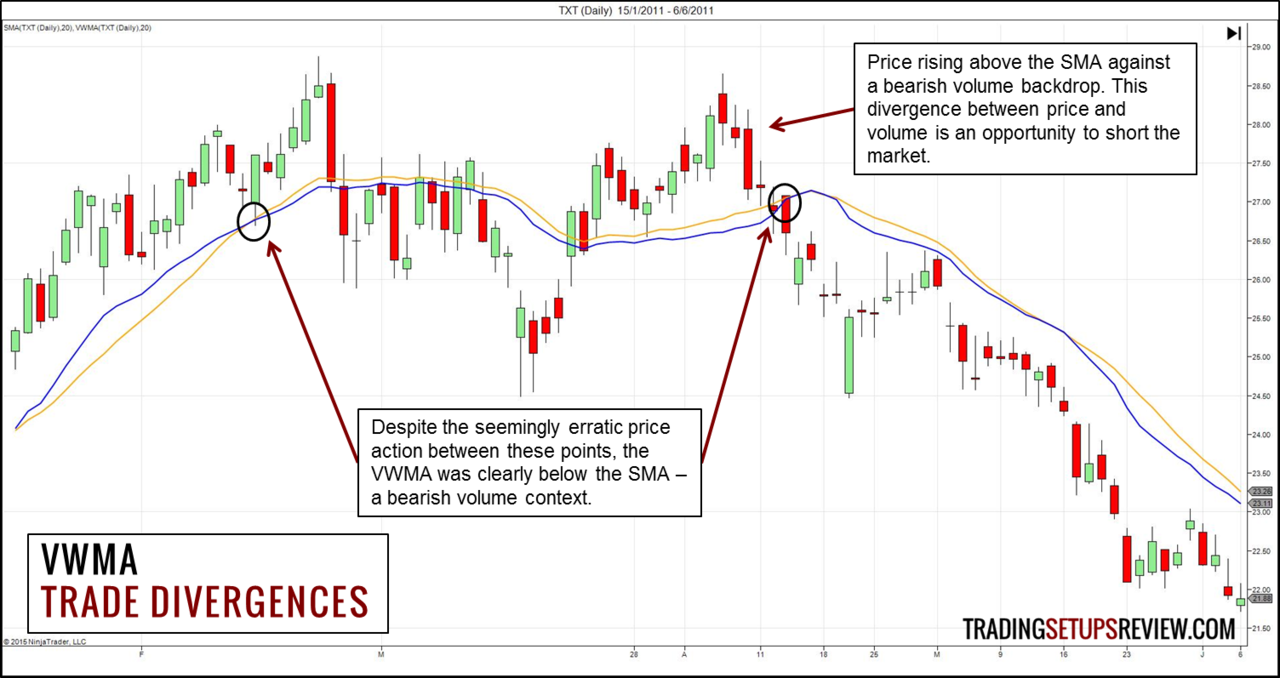
- The price action between the two circles was erratic. Sharp falls and rises together with messy meandering.
- But the VWMA issued a surprisingly straightforward opinion. It stayed below the SMA for the entire period, suggesting that the volume was not on the side of the bulls.
- The swing above the moving averages presented a divergence. The bullish price action diverged from the bearish volume backdrop.
- For bearish traders, this divergence offered a trading opportunity. But remember that if you’re going for a reversal trade, it’s wise to act only if there’s a confluence of reasons to do so.
From a price action perspective, there was a lack of bullish streaks within the sideways consolidation. This supported the bearish volume backdrop.
- There were no three-bar bullish thrusts.
- On the other hand, there were several three-bar bearish thrusts, and the final one pushed below the moving averages.
As you can see, the VWMA is useful for tracking the price-volume context. However, it does not trigger a trade.
Consider other indicators or price patterns as your trade trigger. For instance, Example #1 below points to three bullish reversal bars that could serve as trade triggers.
Trading Examples
Now that we have a sense of how to interpret the VWMA, let’s look at how it might help us in our trading.
Example #1: VWMA Exits and Re-entries
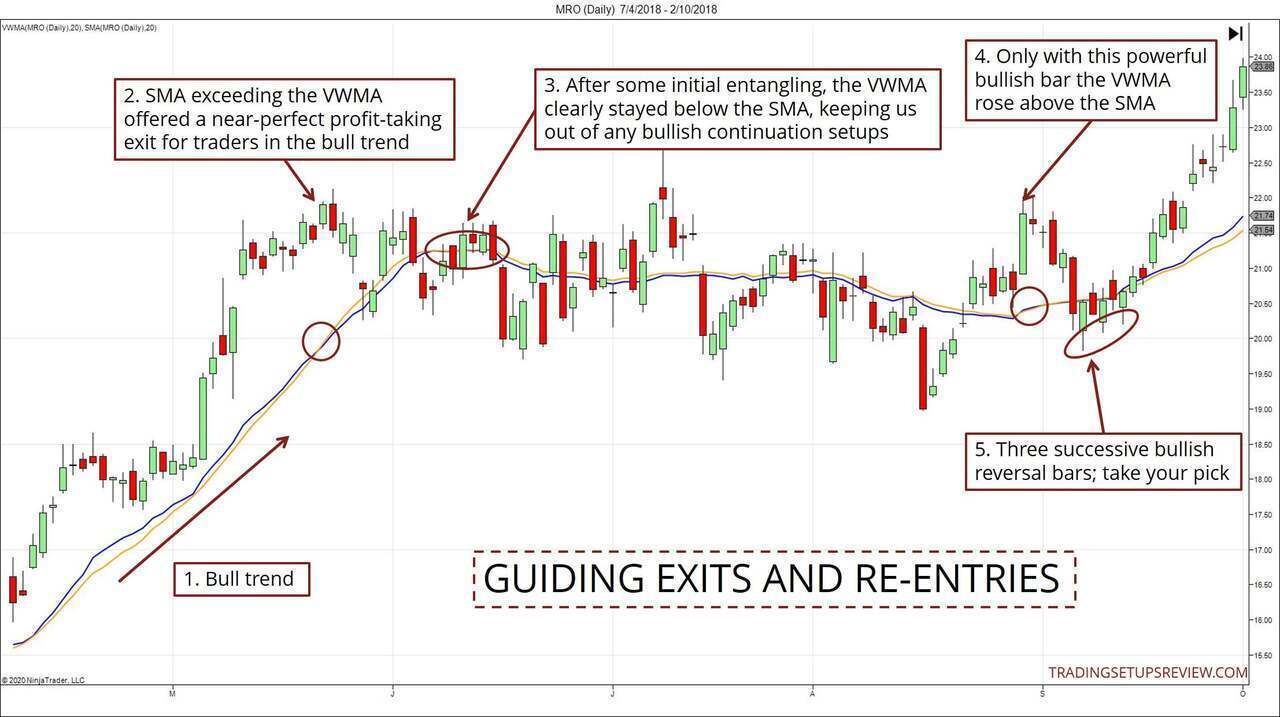
- The market was in an established bull trend. The VWMA was above the SMA for most of the trend.
- At this point, the moving averages switched over. Although it was premature to consider a bearish position, traders who were already long found their perfect exit.
- After some initial entangling, the two moving averages showed a clear gap with the VWMA below. It warned us against entering into any bullish setups in this market consolidation.
- Finally, with this bullish trend bar, the VWMA rose above the SMA. Although the two lines entwined subsequently, this development signaled a change that favored the bulls.
- With the VWMA cueing us in, these bullish reversal bars were potential trade triggers.
Example #2: VWMA With Price Action
One pitfall of using indicators is that you fixate on the indicator signals. In this case, the crossovers between the VWMA and SMA. The consequence is that you neglect price action.
This is why I often advise new traders to start with price action.
Let’s take a look at this example to highlight this point.
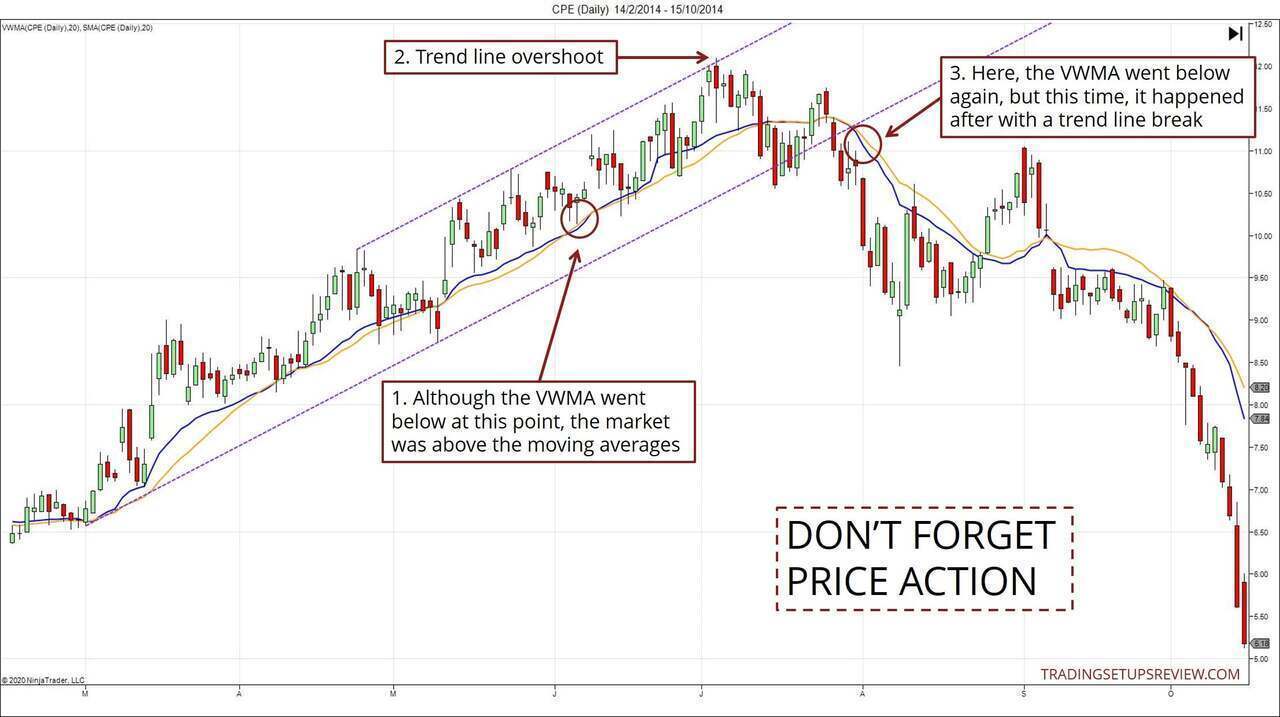
- Although the VWMA dipped below the SMA at this point, the candlesticks remained above the moving averages. Price action did not show any bearish patterns. On the other hand, the long lower shadows of the candlesticks reflected buying pressure.
- A trend channel line overshoot took place at the top of the trend. A channel overshoot serves as an early warning for potential reversals.
- When the VWMA crossed below the SMA again, the price action was in stark contrast with that of Point #1. The market just broke a bull trend line with a streak of three bear trend bars.
The key here is the difference between the two bearish VWMA signals. If you focused only on the indicators, you would have missed out on what’s really happening in the market.
So don’t forget that indicators are helping us to analyze price action.
Volume Weighted Moving Average - A Simple Upgrade
For traders who already use the SMA, adding the VWMA is a simple way to improve market analysis.
Here, we used the look-back period of 20 as it is a typical setting for short-term trading. You can apply the same concept using other look-back periods that are consistent with your trading time-frame.
Using a VWMA with an SMA resembles a dual moving average system like the 9/30 trading setup. However, a typical dual moving average system does not feature volume at all.
This approach does more than stretching the SMA along the same dimension. It adds a new dimension to it with the volume weighting.
Two points to note:
- The space between the VWMA and the SMA reflects the effects of volume-weighting. Thus, when the two moving averages are entwined, it’s a sign of a listless market. In such cases, avoid drawing firm conclusions.
- The VWMA tends to stay below the SMA even in long-lasting bull markets. I’ve observed that this tendency is especially strong among equities over extended periods. Factor this in as you dive deeper into this approach.
In all, the VWMA offers a simple and effective upgrade. Try it out on your charts, and see if it complements your trading strategy.
The article was first published on 3 February 2015 and updated on 18 May 2020.