Flipping Support and Resistance for Swing Trading
By Galen Woods ‐ 4 min read
Learn to make use of support and resistance dynamics for swing trading with the concept of flipping. Get the market behind you and trade with confidence.
The best swing trades seldom hang in the air. Swing traders love having a support or resistance level working for them. However, they often lack a clear method for taking advantage of market support and resistance.
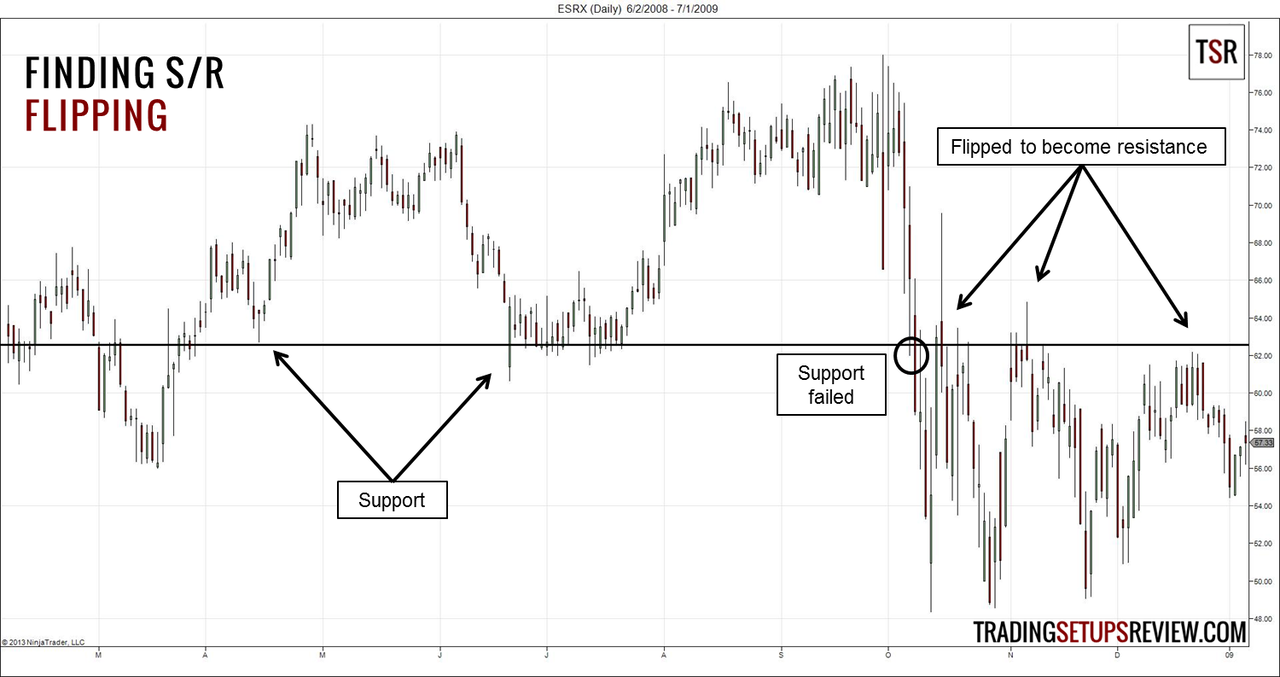
To build a systematic trading approach, we will take a look at “flipping support/resistance”. For a trending market, the flipping of support into resistance and vice versa is a common occurrence.
(If you need a primer for support/resistance and the concept of flipping, click here.)
Swing Trading Rules - Flipping S/R
Long Swing Trade - Broken Resistance Turned Support
- In a bullish context, take the high of a trend as resistance.
- If the resistance is broken with clear momentum, take the broken resistance as a support level.
- Wait for the market to fall and test the support.
- If the support holds up, enter with any bullish price pattern.
Short Swing Trade - Broken Support Turned Resistance
- In a bearish context, take the low of a trend as support.
- If the support is broken with clear momentum, take the broken support as a resistance level.
- Wait for the market to rise and test the resistance.
- If the resistance holds up, enter with any bearish price pattern.
Swing Trading Examples - Flipping S/R
Winning Trade - Support & Resistance
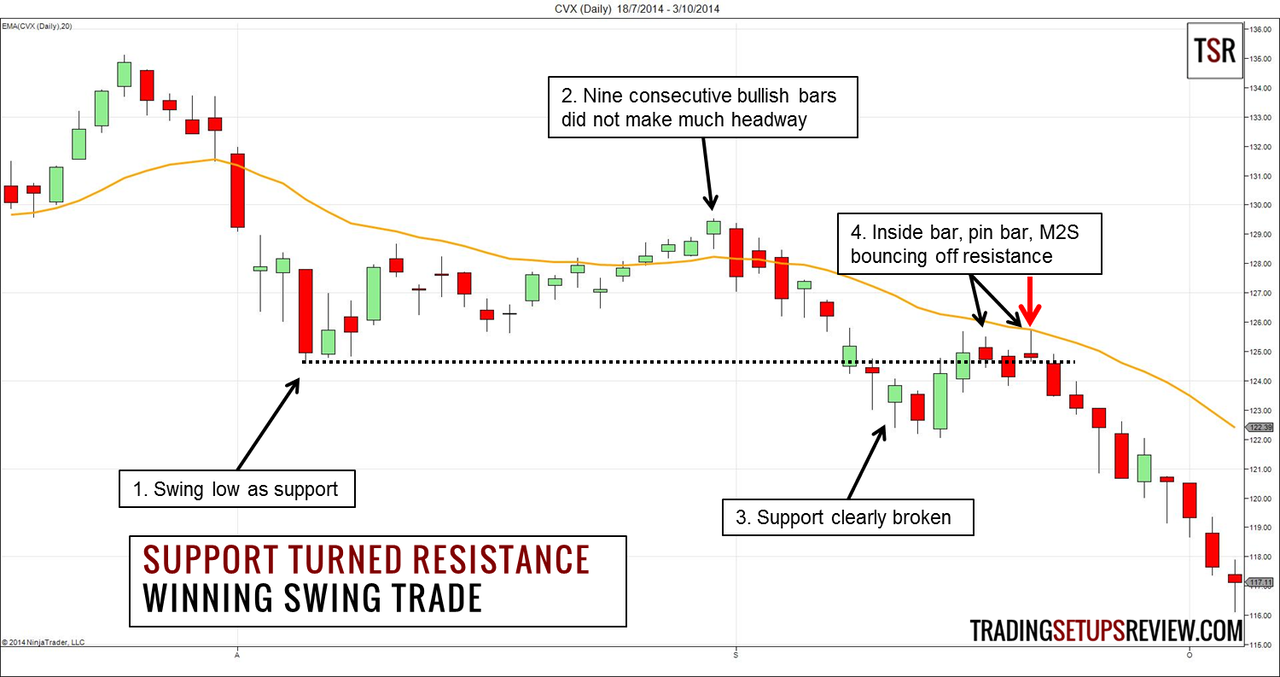
This is a daily chart of Chevron Corporation (CVX on NYSE) with a 20-period EMA. It started above the EMA but quickly fell below it, prompting a possible bear trend.
- As the market made its first attempt to resume the bullish trend, a swing low formed as a support level.
- However, after nine consecutive bullish days, the bulls were unable to re-assert their strength.
- The downswing broke the support level decisively and confirmed the bear trend.
- The pullback up to the broken support found resistance. The bears showed up in a variety of setups including a bearish inside bar, pin bar, and Al Brooks’ M2S. We could use any of the price patterns to trigger a short trade.
Losing Trade - Support & Resistance
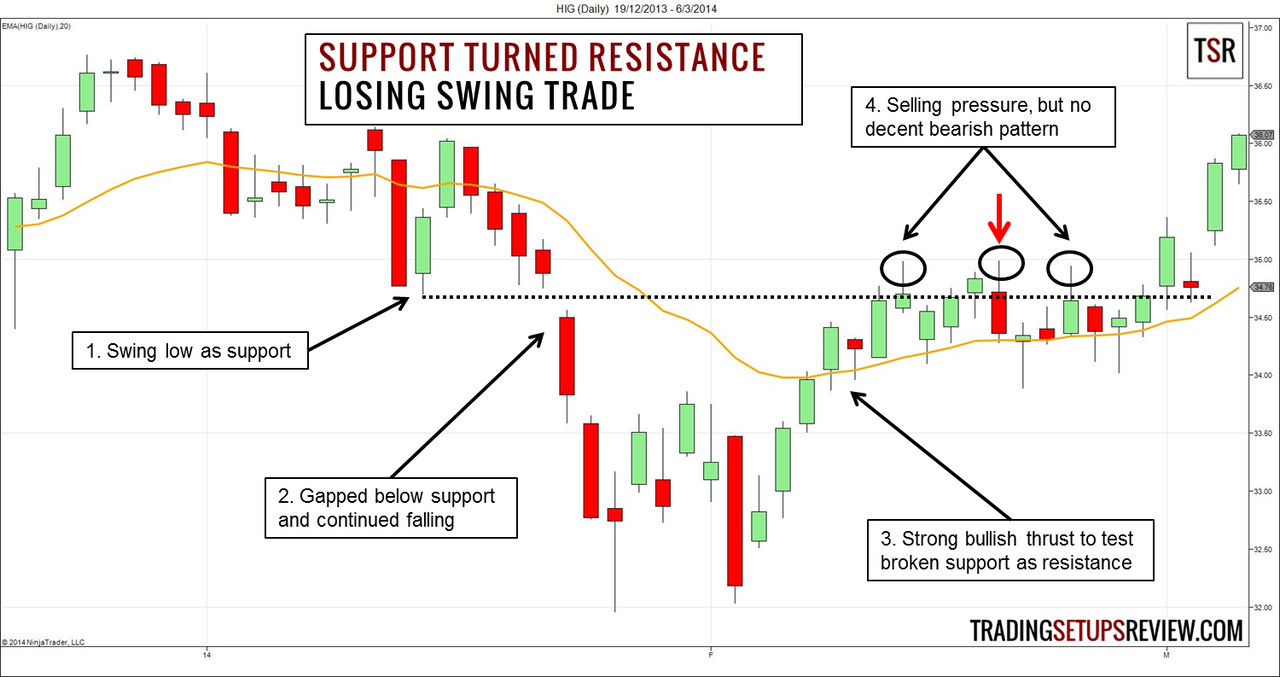
The chart above shows the daily bars of Hartford Financial Services Group (HIG on NYSE). Like the winning example, this chart started above the EMA.
- A solid two bar upthrust created this swing low which became a potential support.
- The support failed as the market gapped below it and fell for three days.
- After a wide-range sideways movement, HIG rose to test the broken support as resistance. The rise was sharp and pushed prices above the EMA.
- The top tails showed selling pressure around the resistance level. The bearish outside bar offered an entry point for short trades.
However, take a closer look and you will see that there were equal buying pressure shown by the bottom tails in the same area. Furthermore, outside bars are generally not ideal setup bars as they show erratic price action.
Together with the strength of the upswing mentioned in point 3, the context was poor for a bear swing.
Review - Swing Trading with Flipping S/R
Optimal setups show a clear break of the support (resistance), and a weak test of the broken support (resistance). If you get these conditions in the right context, this trade setup has a high chance of success.
However, the drawback of this strategy is that such ideal trades do not occur often.
The key advantage of this trading setup is that we avoid getting mired in blur trends. We are looking to trade the flipping of support into resistance and vice versa. Thus, we wait for a clear and decisive break of the support/resistance (as stated in rule no. 2). Requiring this clear break keeps us on the side of strong and clear trends.
This is just one of the many ways to swing trade with support and resistance. You can work out your own approach after understanding the market dynamics of support and resistance.