RSI Hidden Divergence Pullback Trading Guide
By Galen Woods ‐ 8 min read
The RSI hidden divergence is a reliable method for trading pullbacks. It defines a low-risk zone for joining market trends. Learn more in our trading guide.
Divergence strategies? They are for trading reversals, right? Well, not always. In this article, we will focus on its clandestine sibling - the hidden divergence. This less-known occurrence sets the stage for continuation trades and not reversal trades.
You can identify both regular and hidden divergences with most trading oscillators. Examples include MACD, Stochastics, and RSI.
For ease of discussion, here, we will focus on Wilder’s RSI oscillator. The RSI indicator is available on most charting platforms and is a familiar tool for most traders.
Regular Versus Hidden RSI Divergence
Before we dive into the examples, let’s contrast a regular divergence with a hidden one. Appreciating their differences will help you to internalize both concepts.

To find divergences (regular or hidden), you need to spot swing pivots on the RSI indicator plot. The concept of swing pivots on indicator plots might be unfamiliar at first. But with some practice, you’ll quickly get used to it.
Regular Signal
A regular divergence occurs when the momentum does not support a price trend.
Momentum refers to the rate of price change as measured by the oscillator. In this case, it is the RSI indicator. A rising RSI shows bullish momentum, and a falling RSI implies negative momentum.
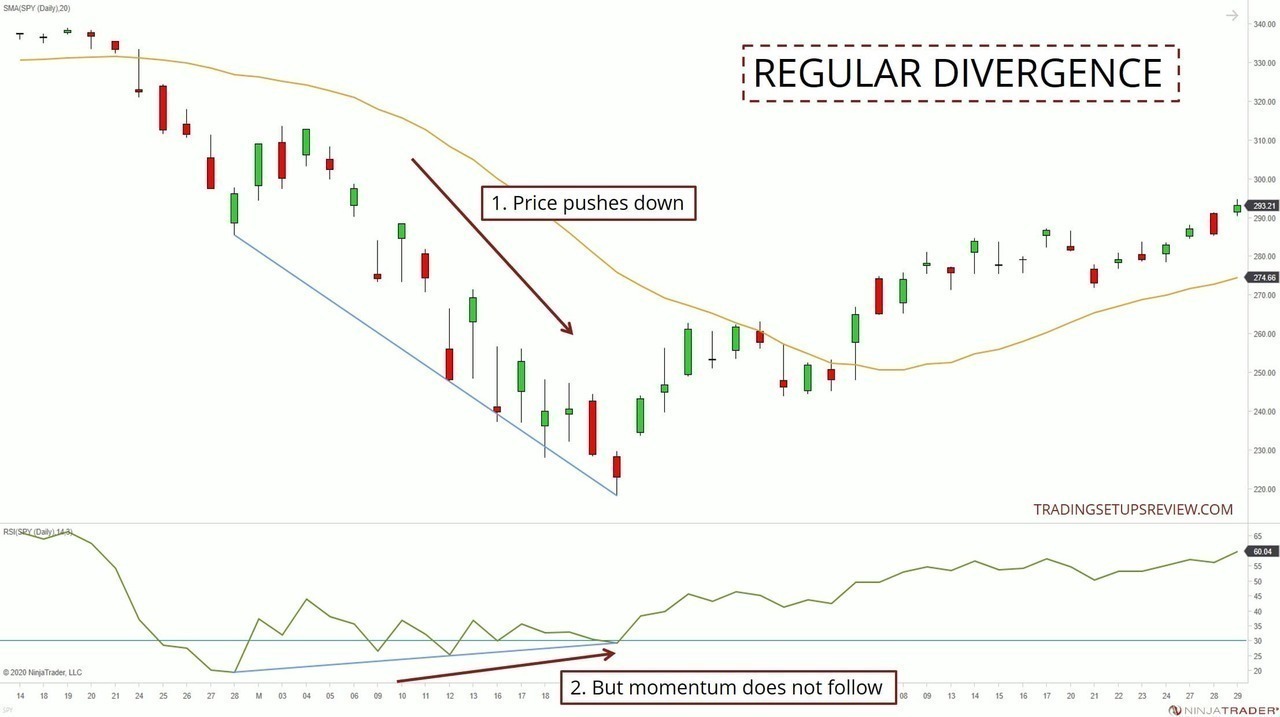
- The chart above shows a regular RSI divergence in the context of a bear trend. Under these circumstances, it is a bullish reversal pattern.
- Here, the market is making lower price lows. However, the downwards momentum is faltering. We can infer this from the rising RSI swing lows.
This divergence between price and momentum implies a theoretical weakness in the trend. Hence, the conventional approach construes this as a reversal signal.
(Note that in practice, it is not that straightforward to pinpoint a reversal. This is because such divergences can persist longer than you expect.)
Hidden Signal
On the other hand, a hidden divergence occurs when the trend holds up despite the momentum going against it.
It offers a continuation signal.
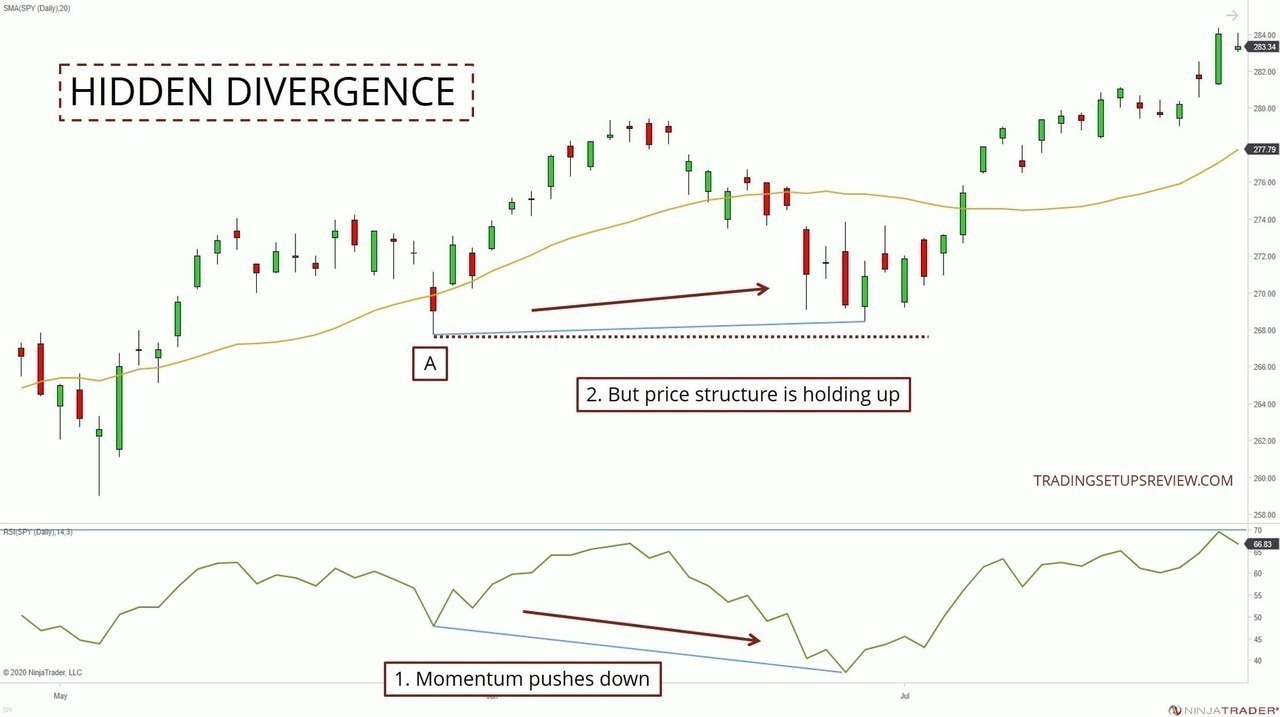
In the chart above, we see an instance of hidden divergence in the context of a bull market.
- Despite the growing bearish momentum implied by the RSI, the trend structure held up. Hence, the hidden divergence represents a window for joining the bull trend at the bargain.
- If the market had fallen below the “A” swing pivot, the hidden divergence would have become invalid. In that case, price and momentum have converged. (i.e., lower lows on both price and RSI plots.)
RSI Hidden Divergence Trading Examples
Some traders identify a hidden divergence and jump into the market immediately. But I find it more useful to think of a hidden divergence as an alert for possible continuation setups.
Once the alert is issued, we can start looking for continuation trade entries. Short-term bar patterns are helpful at this stage.
Example #1: Looking For A Hidden Divergence
This example shows the daily chart of the EURUSD currency pair. The RSI plot is below the candlestick chart.
For this first example, let’s reiterate the steps to find a hidden divergence.
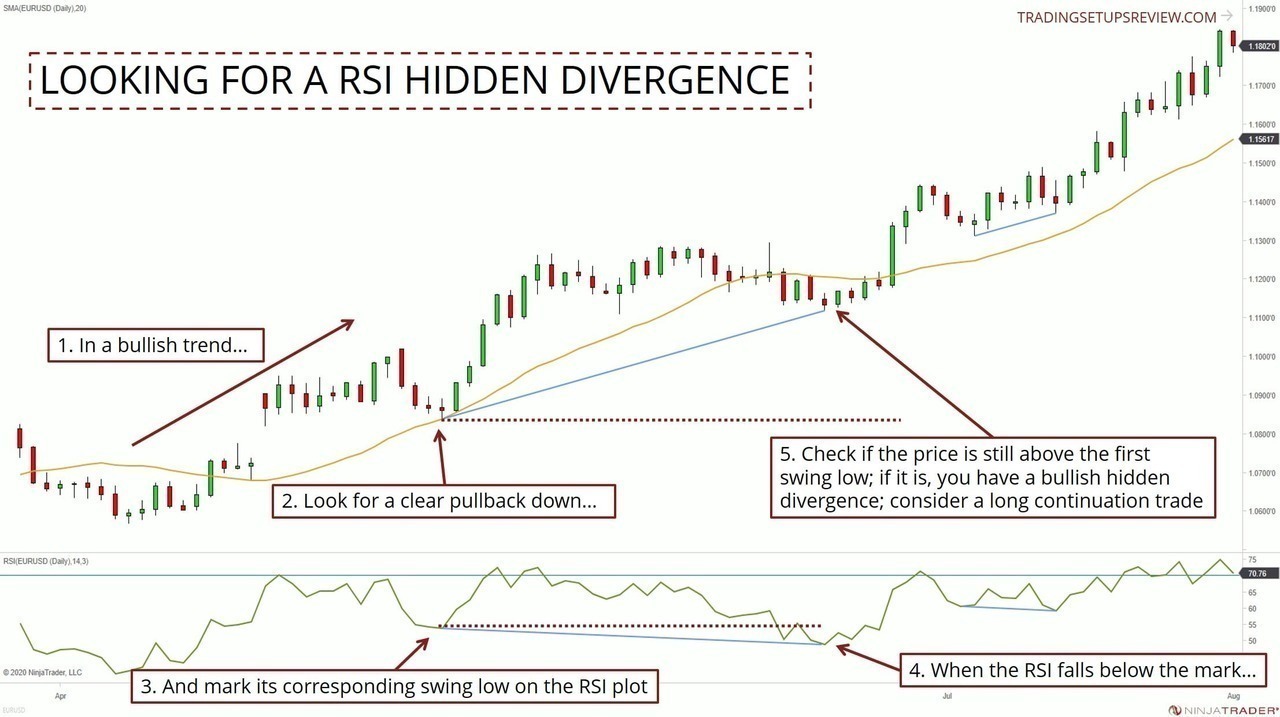
- The market kickstarted a bull trend with a gap pushing away from the SMA.
- When looking for the first swing low of a hidden divergence, use pullbacks that stand out in the chart.
- Next, look for the corresponding swing low on the RSI plot and mark that level.
- Once the RSI falls below this level, it’s time to return to the candlestick chart. We want to find out if the market is still above the first swing low, despite the negative momentum.
- Here, prices are indeed still above the first swing low. This firm bullish structure confirms that a hidden divergence is in place. At this point, we can look for long setups to join the rising market.
We will not prescribe an exact entry method here, but you can consider the following:
- Enter immediately at the market price with a volatility stop-loss to control your risk.
- Wait for a bullish price pattern and use a pattern stop-loss.
- Wait for a higher high to form on the RSI plot as confirmation before entering.
In the next example, we will see the second method in action as we use a Pin Bar to time our trade.
Example #2: Hidden Divergence With Pin Bar Entry
The chart below shows the daily candlesticks of the GBPUSD forex pair.
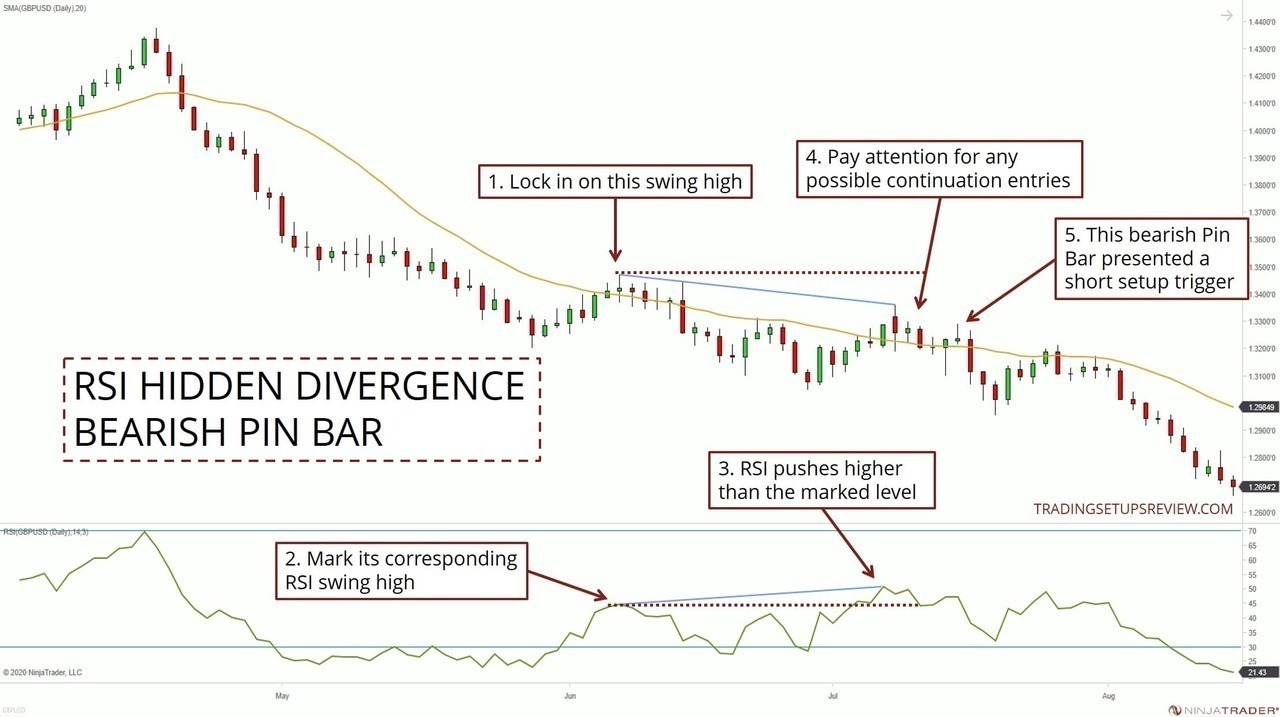
- This was the first proper pullback in this bear trend, so let’s anchor our analysis with this swing high. (The earlier pause in the trend took the form of a sideways range.)
- As usual, we marked a line on the corresponding RSI swing high.
- Here, the RSI pushed above the line, implying bullish momentum. This also initiates a hidden divergence signal. It was time to look for continuation trade setups.
- Hence, we turned to scrutinize the candlestick chart for short entries.
- This bearish Pin Bar followed a fantastic bullish Pin Bar. The lack of followthrough of the bullish Pin Bar was telling. It confirmed that the bulls were not getting support. Entering just below this bearish Pin Bar was a good idea.
Since you already have the RSI on your chart, consider using it to guide your profit-taking. The RSI exit is useful for traders looking for quick trades with minimal adverse movement.
For instance, here, consider exiting after the RSI falls below 30. Tightening your stop-loss is also an option. If you prefer to manage positions in parts, it was a chance to exit a part of your position.
Example #3: Avoiding Trouble Zones
This example shows how waiting for a hidden divergence can keep you out of trouble.
Over time, you’ll realize that methods that keep you out of the market are as important as strategies that take you into one.
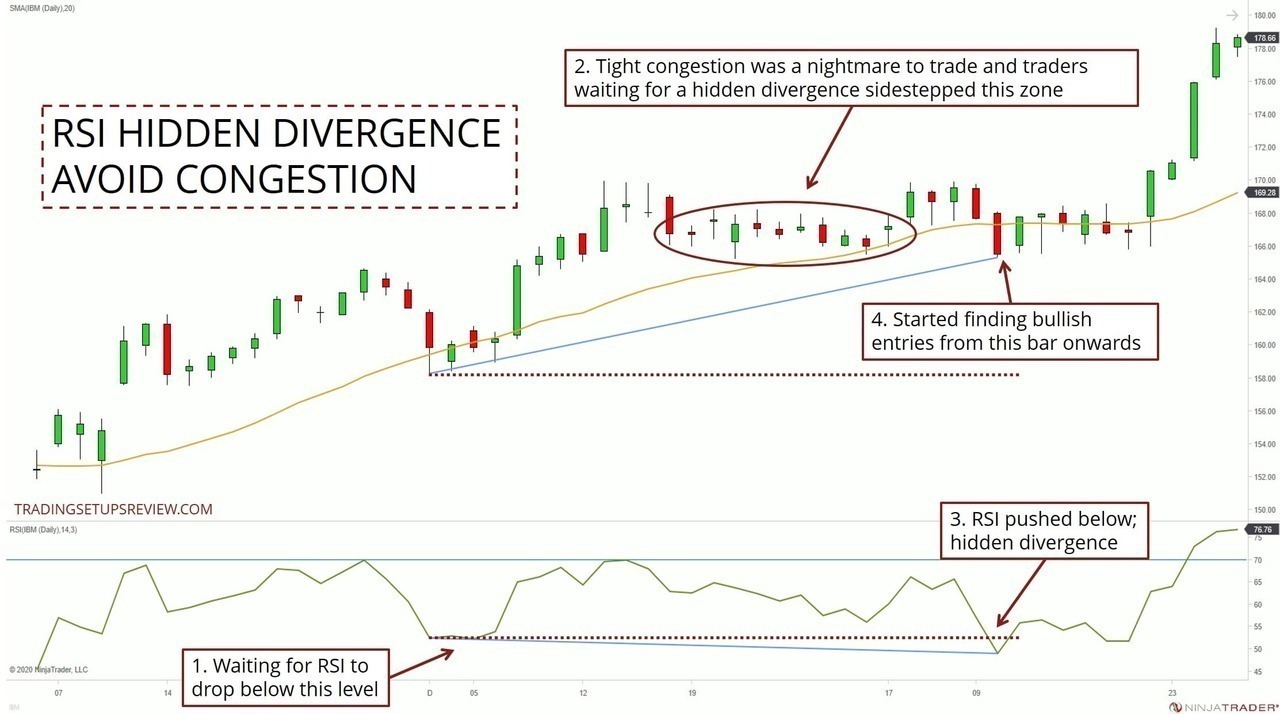
- This swing low was the anchor for identifying a hidden divergence. We marked a line on the RSI plot and watched out for any dips below it.
- Attempts to trade during this tight congestion would have resulted in multiple whipsaws. However, we stayed out because the RSI had not dipped below the marked level.
- This burst of negative momentum was the signal we needed. It pushed below the marked RSI level and confirmed a bullish hidden divergence.
- From this point on, there were a couple of great-looking bullish price patterns. An example is the bullish Pin Bar (also an Outside Bar) that followed the bearish thrust. It presented an efficient entry into the trend while avoiding the earlier congestion.
The market continued sliding sideways after the hidden divergence signal. But the trend resumed after a few bars and did not cause much frustration for us.
Example #4: Missing Out On Pullbacks
No approach is perfect. One of the drawbacks of the hidden divergence is that you might miss out on a series of pullback trades.
We’ll see that in this example.
Pointing out that a strategy does not work is messier than clean textbook examples. So go through it slowly to follow the analysis.
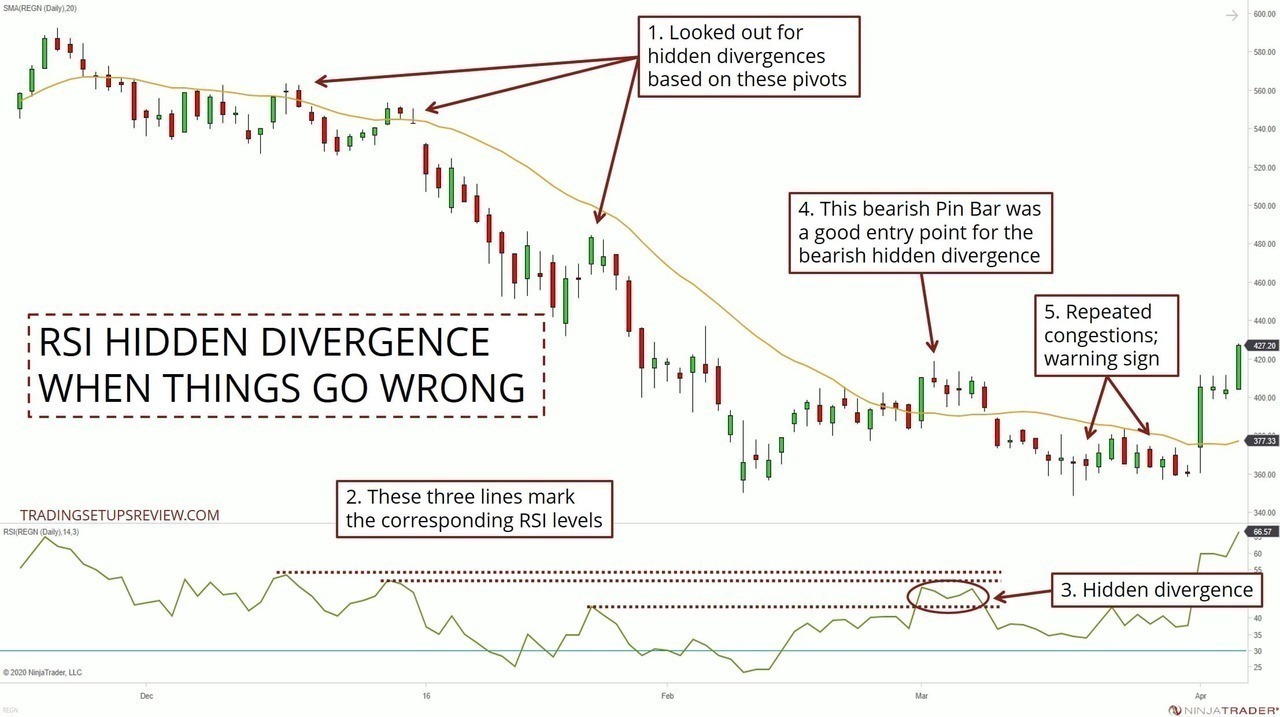
- There were three key swing highs in this bear trend. We used them to identify possible hidden divergence.
- To do so, we had to mark the corresponding RSI swing highs. However, none of the RSI swing highs were breached despite multiple pullbacks. Hence, we missed out on several opportunities to join the bear trend.
- Finally, the hidden divergence signal materialized as the RSI made a higher high.
- This bearish Pin Bar was a reasonable short entry. But as you can see, the bear trend failed to resume.
- There were repeated congestions after the Pin Bar entry. Nimble traders would have seen them as warnings and scratched the trade. However, it does not change the fact that the hidden divergence did not work well.
Here, the RSI hidden divergence kept us out of the entire trend.
Then, it signaled us in at the worst possible timing, just as the trend was about to reverse. In this instance, the hidden divergence approach has failed the pullback trader.
But let’s put things into perspective.
Every pullback trading method needs to deal with the trade-off between:
- Getting in at a reasonable price (with minimal risk);
- And the number of trades.
The hidden divergence leans towards sacrificing the number of trades for low-risk entries. Understanding this will reduce your frustration when you encounter multiple missed setups.
Of course, this is not to say that the hidden divergence method is perfect. Far from it.
But it’s important to know that switching to another pullback strategy will not solve this trade-off problem. Instead, learning how to apply an approach and gaining experience is the path to consistent performance.
Trading Tips And Review
As we’ve pointed out, when marking hidden divergences, the choice of the first swing pivot is critical.
Choose a solid pullback swing that stands out on the chart. It leads to a more reliable RSI hidden divergence. Don’t choose a meandering sideways consolidation.
If you review the examples above, you’ll find a few regular divergences as well. Regular divergences point to reversal, while the hidden ones get you into pullbacks. Such conflicting signals present a problem for our analysis.
But unless other factors support a reversal, give more weight to hidden divergences. (Examples of reversal factors are climactic volume, significant support/resistance, and prolonged congestion.)
Finally, let’s wrap up by reconciling the standard RSI strategy with the hidden divergence.
Recall the standard oversold and overbought RSI strategy. When the RSI falls below 30, we buy; when the RSI rises above 70, we sell. This basic strategy uses arbitrary levels of 30 and 70.
Think of the hidden divergence approach as necessarily the same strategy.
However, instead of 30/70, we use oversold and overbought levels implied by the first swing pivot. (For instance, in Example #1, we were using RSI value 55 as the oversold level.) Hence, this approach seeks to adapt to current market conditions.
If you want to learn more about hidden divergences, check out this review on the MACD Hidden Divergence.