Low Volume Pullback Strategy (Expanded)
By Galen Woods ‐ 5 min read
The low volume pullback strategy adds much-needed confirmation to a trend retracement trade. Master this trading method with confidence.
Technically, a healthy trend should advance with increasing market interest. When a trend retraces temporarily, the market interest falters.
The question is how do we gauge market interest?
The best information we have to assess market interest is volume. High volume indicates strong market interest; low volume shows weak participation.
This idea forms the basis of the Low Volume Pullback Strategy we discussed earlier.
Recap - Low Volume Pullback Trading Setup
In all the charts that follow, if a bar has green background, its volume is higher than that of the preceding bar. If a bar has red background, its volume is lower than that of the preceding bar.
Let’s recap our basic formula for this strategy before expanding on it. (For simplicity, we will stick to the context of a bull trend.)
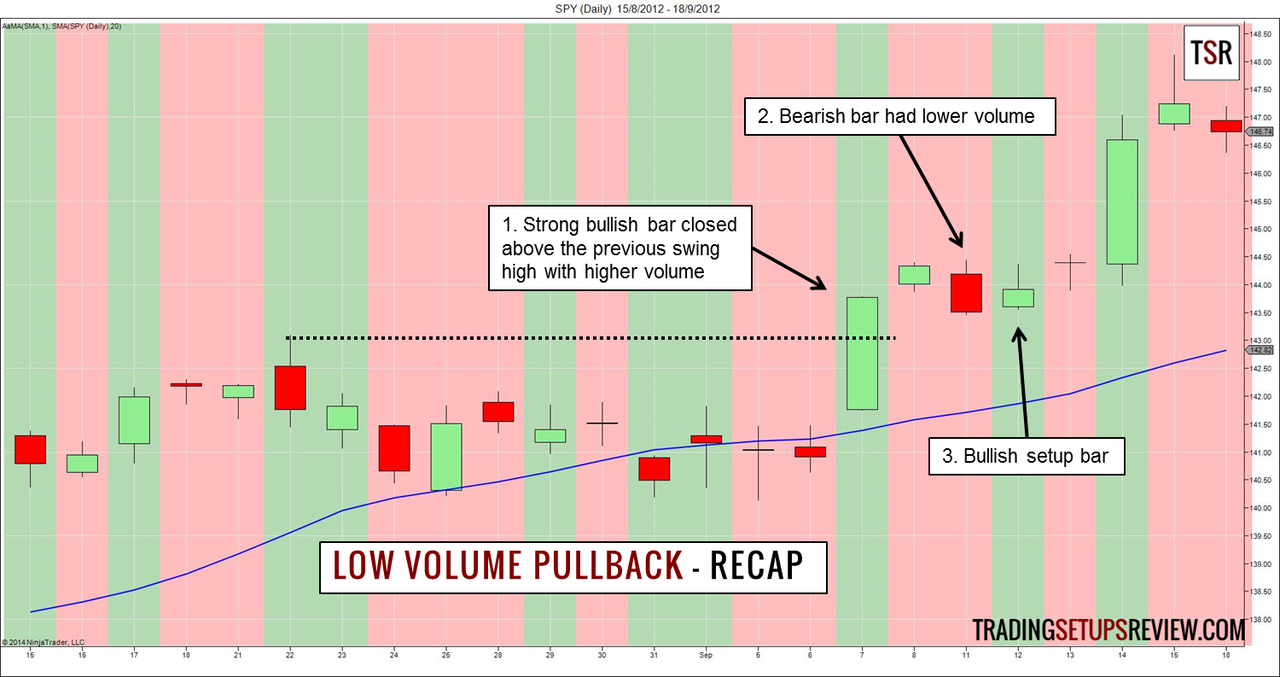
- We want to see market interest (volume) at new trend highs. Increased volume at a new swing high confirms a healthy bull trend.
- We want to see a lack of market interest as the market falls. Trend reversal needs renewed market interest in the opposing direction. When such interest is not forthcoming, the price drop is more likely to be a pullback than a trend reversal.
- With a solid volume context working for the bulls, any bullish bar is a decent setup bar.
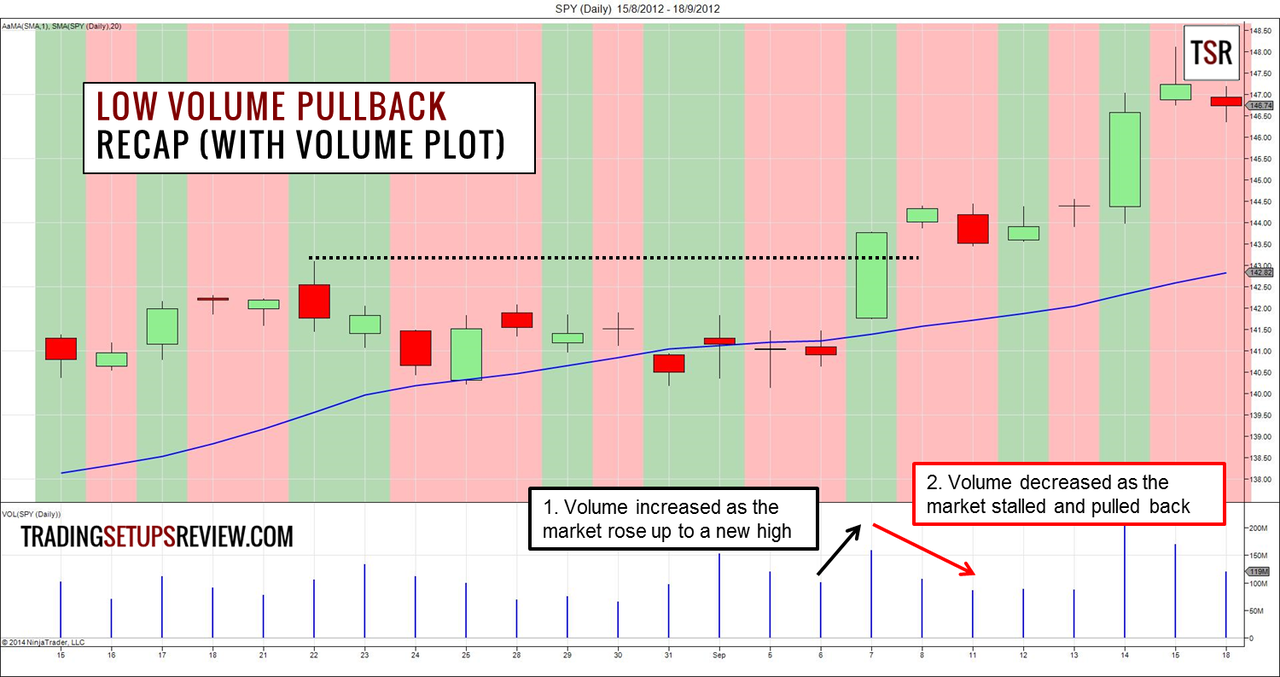
To make sure that we are crystal clear on how to interpret the background green and red colors, I have reproduced the chart above with its volume plot.
Expand - Low Volume Pullback Trading Setup
In this sequel, I will focus on three examples. My aim is to show how the best Low Volume Pullback trades look like, and how to avoid trends that are poised to reverse.
The first two examples show high-quality pullback trades with the following characteristics:
- Sustained lower volume (volume decreasing over two to three bars)
- Lower volume bars show counter-trend tendencies. (For e.g. higher bar high in a down trend or bearish bar in an up trend)
- Volume dries up as the market approaches a support/resistance level
Example 1 - Gap Testing with Low Volume
The chart below shows the daily bars of GameStop Corp. (GME) 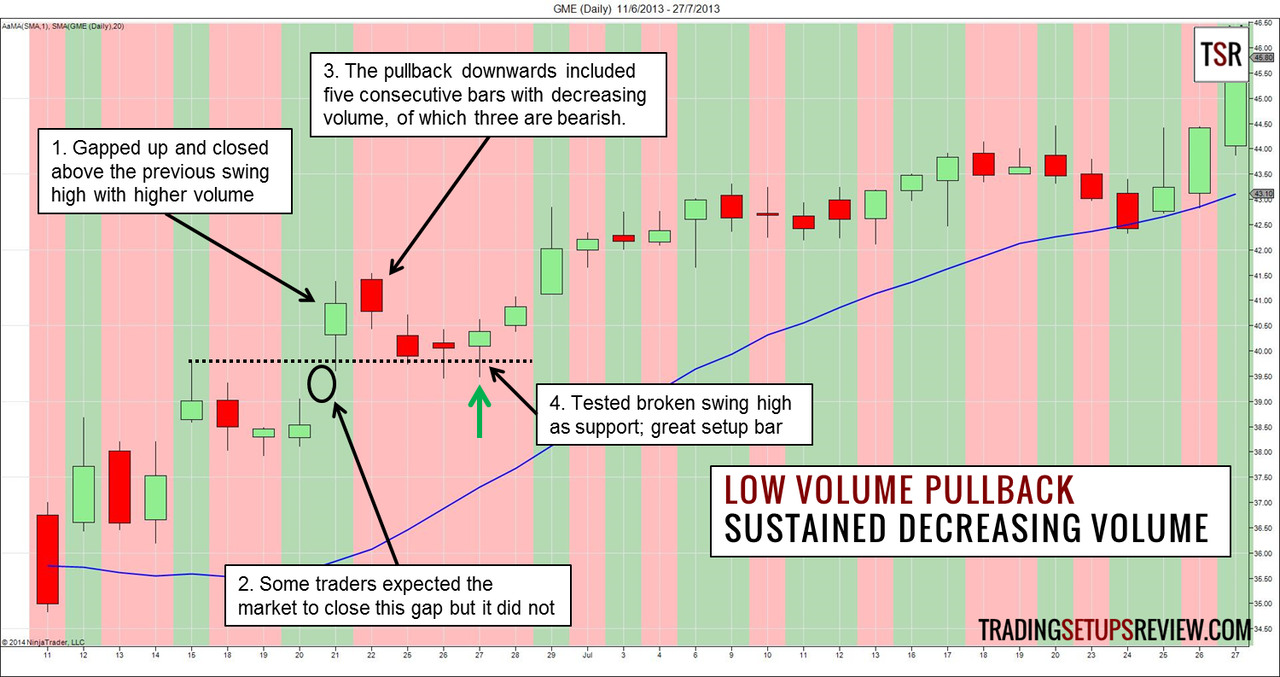
- This bar gapped and closed above the last swing high with higher volume (green background). It was a sign of a healthy bull trend.
- Some traders expected the market to close this gap. The fact that it did not was another bullish sign.
- The pullback showed sustained lower volume over five consecutive bars (red background) . In particular, the three bearish bars that started the pullback did not seem to generate much interest from the market.
- Hence, this bullish bar offers a low volume pullback setup. As it was also bouncing off a support level formed by the broken swing high, it was a great setup. (Learn more about the flipping of support and resistance.)
This example shows how observing volume in isolation is not enough for finding top quality trades. We need to combine basic price action analysis to confirm them.
Example 2 - 50% Pullback with Low Volume
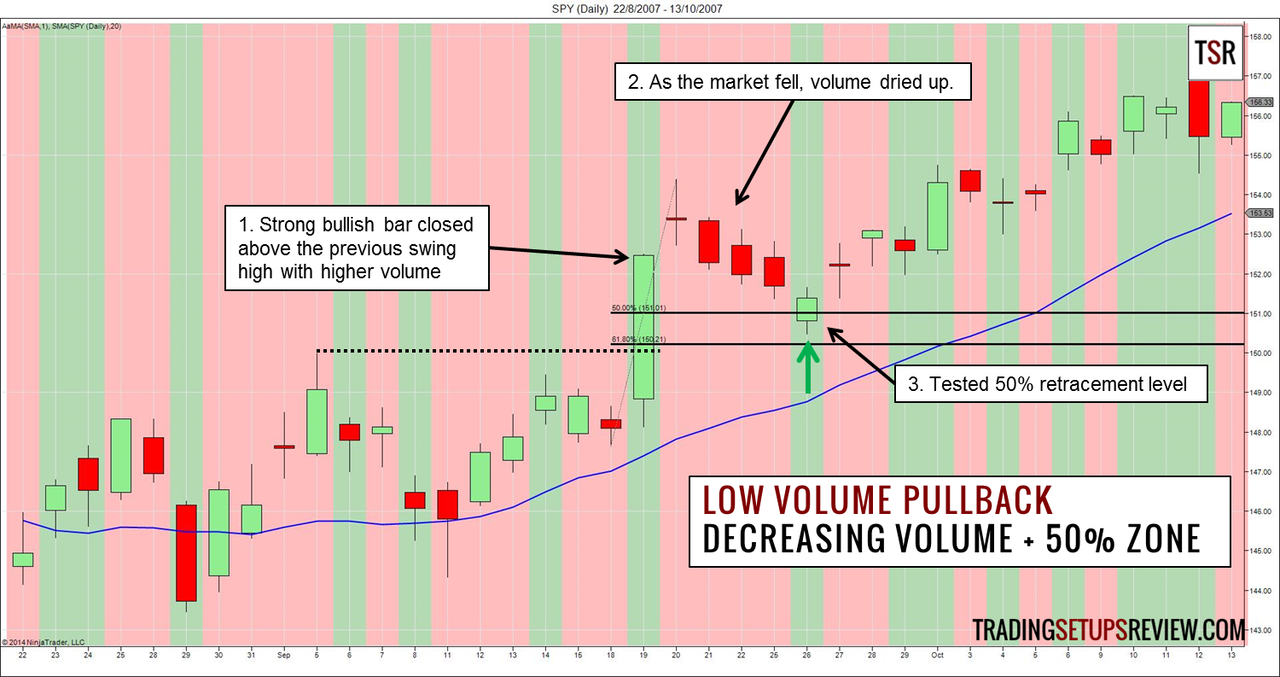
This chart shows the S&P 500 ETF (SPY) in its daily time-frame.
- This strong bullish bar rose above the last extreme high of the trend without resistance. This set the stage for a long pullback trade.
- This neat bear swing found less and less market interest as it descended.
- Higher volume returned only with a bullish reversal bar at the 50% retracement level based on the last bull swing. The context implied a great long trade.
(The zone between the 50% and the 61.8% retracement levels is my favourite Fibonacci retracement zone.)
Example 3 - Climatic Moves Reverses (And Do Not Confirm) Trend
We used higher volume at new trend extremes as a sign of a healthy trend. But there is an important exception.
It is when the volume is unusually high. Climatic price action and volume is a sign of trend exhaustion and might lead to reversal. Hence, under such circumstances, we should not look for pullback trades.
Let’s take a look at an example. The chart below shows the daily chart of Staples Inc. (SPLS)
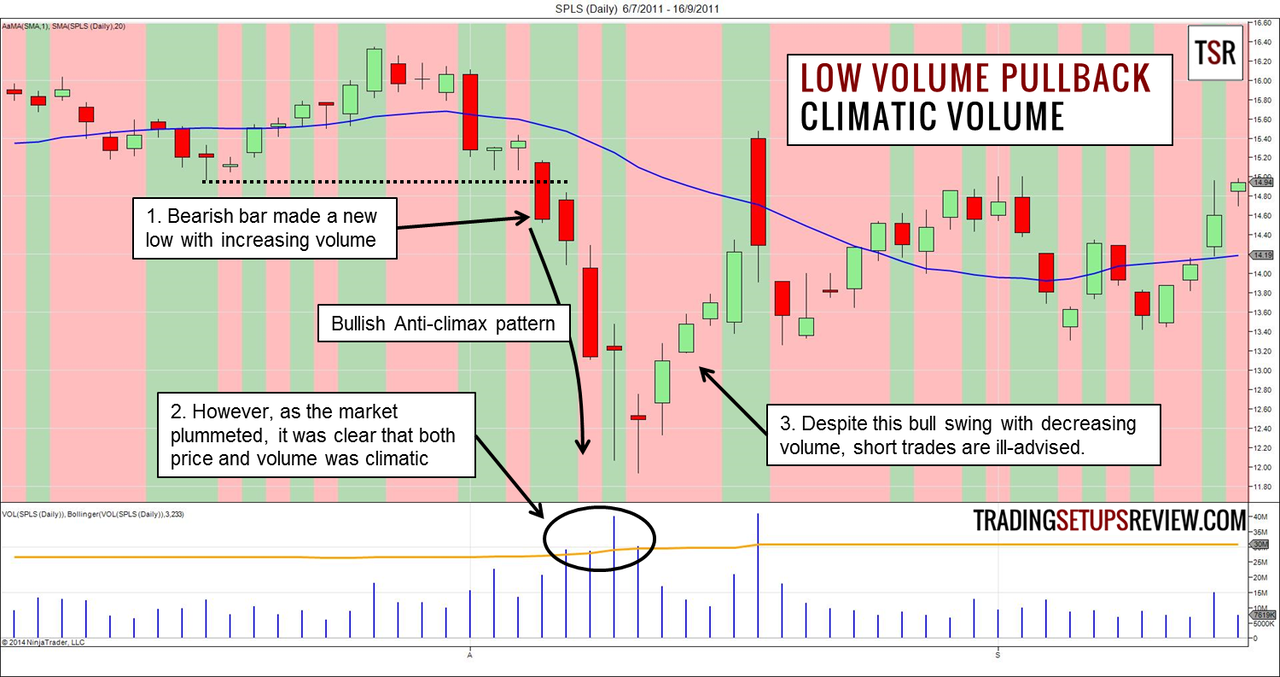
- This bar closed at a new low with higher volume. The next bar continued to fall with increasing volume.
- However, as the market continued its free fall, it was clear that volume has reached climatic levels. (I use the Bollinger Bands (233,3) of the volume plot to help find climatic volume. It is the same tool I applied to find Anchor Bars.)
- The plunge was likely to be exhaustive. Thus, despite this nice upswing with weakening volume, we did not look for short setups.
The scary plunge was also a bullish Anti-Climax pattern. It is a pattern covered in the free chapter of my “Day Trading with Price Action” course.
Combine Low Volume Pullbacks with Support & Resistance
While low volume on pullback offers windows of opportunity, the best trades do not rely solely on volume analysis. Both the price action of the lower volume bars and the support/resistance around them are also critical.
To find Low Volume Pullback trades, swing traders can scan for stocks with decreasing volume over the past three days. Then, assess the support and resistance surrounding the price action before taking on a position.
I formulated this strategy based on the Dow Theory’s tenet that volume should confirm the trend. And it represents just one way to make use of volume in our trading.
If you want to learn everything you can on volume analysis, Anna Coulling’s book is the best starting point.