3 Examples of Bar-by-Bar Price Action Analysis
By Galen Woods ‐ 6 min read
Bar-by-bar analysis is the hardest part of price action trading. Learning by examples is the best way to pick up this discretionary but practical skill.
Bar-by-bar analysis is the hardest part of price action trading. Traders have even devised methods to make it easier – ranging from bar patterns to checklists.
Whatever method you use, these examples will make you re-think how you look at price action.
Why? Because they show that price action is a discretionary skill, and there is no magic formula. It’s a skill you can hone through experience, but it’s not a skill you can gain overnight.
What is Bar-by-Bar Analysis?
Bar-by-bar analysis does not mean that every price bar is significant. It does not mean that you must attribute some meaning to each price bar you see.
In that case, why do we call it bar-by-bar analysis? Because it works on the principle that every bar might be important.
Might be important. This is why it’s necessary that we pay attention to each price bar.
Might be important. This is why we must not over-analyze. You can struggle to give some value and meaning to each and every price bar, but the effort is not worth it. Usually, it does more to confuse you.
This is also why you will find that I’m skipping bars in the analysis below. I am not cheating, that’s just how price action analysis works.
Analyzing price action is about:
- Figuring out what is happening now to
- Form expectations of the future as a basis for
- Evaluating what really happens so as to
- Anticipate what will happen.
It’s not about making impressive predictions that are always right.
Ground Rules for the Examples
In these examples, we will:
- Select a random part of a chart.
- Focus on analyzing a 20-bar section.
- Use the most recent pivot high and low to offer an analytical context.
The examples below might be a little overwhelming. At least for those who are not familiar with price action analysis. You might want to check out some of these articles first before tackling the examples.
Example 1 - HD Daily Chart
In this example, we will look at the daily price chart of Home Depot (HD on NYSE).
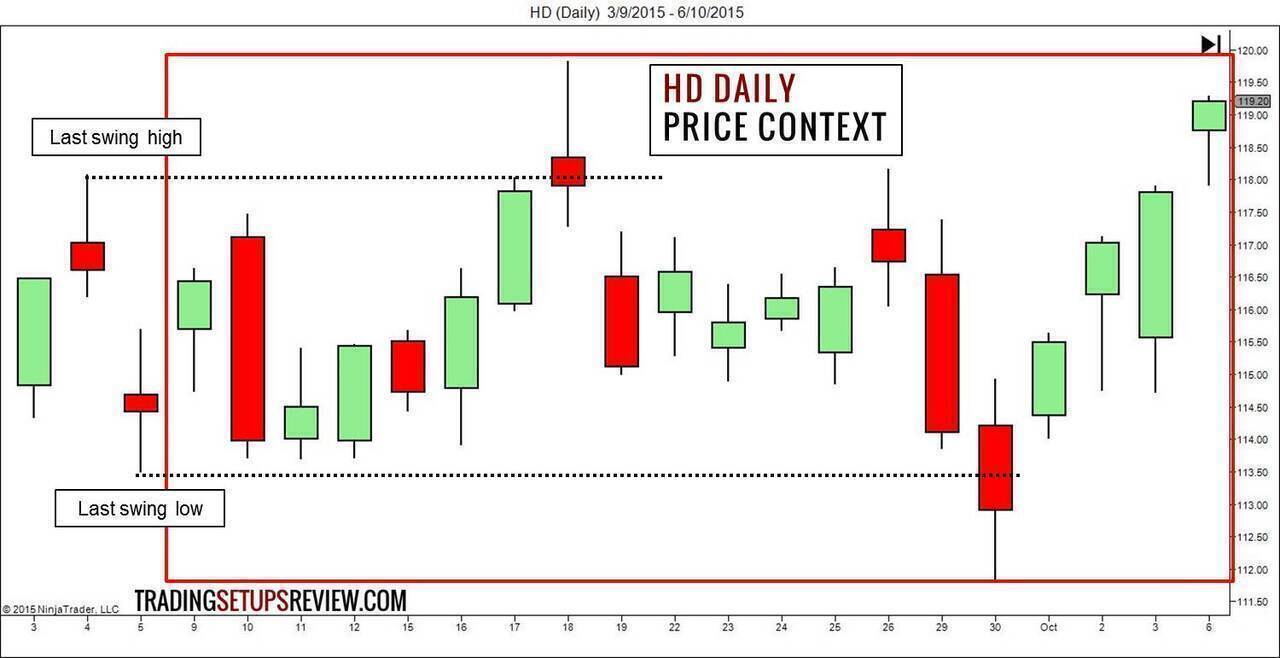
Price Action Context
In the red box, you will see the 20 selected price bars. The two dotted lines mark out the most recent swing high and low just before the selected area.
Bar-by-Bar Analysis
The chart below shows the analysis. It’s wordy. Click on it to enlarge.
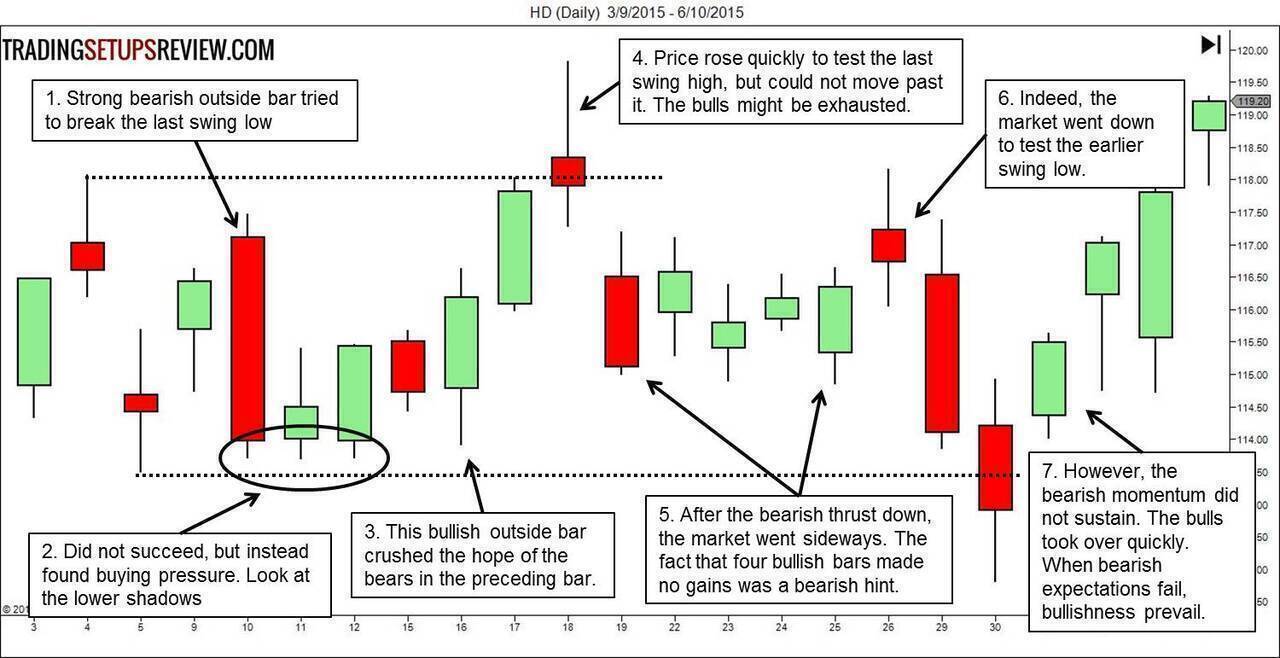
- This bearish outside bar tried to reach for the last swing low.
- It failed, and the market found buying pressure instead.
- The preceding bearish bar was a test to see if the buying pressure would hold. And this bullish outside bar confirmed that the bulls were serious.
- However, price rose quickly in a climatic way to test the last swing high. Despite the seemingly strong upwards thrust, the market could not clear above the resistance.
- The market fell and went into a trading range. The four consecutive bullish bars did not push the market higher. Note its bearish implication.
- Indeed, the market went lower after that.
- However, the market rebounded quickly. (Remember that when bearish expectations fail, the bulls prevail.)
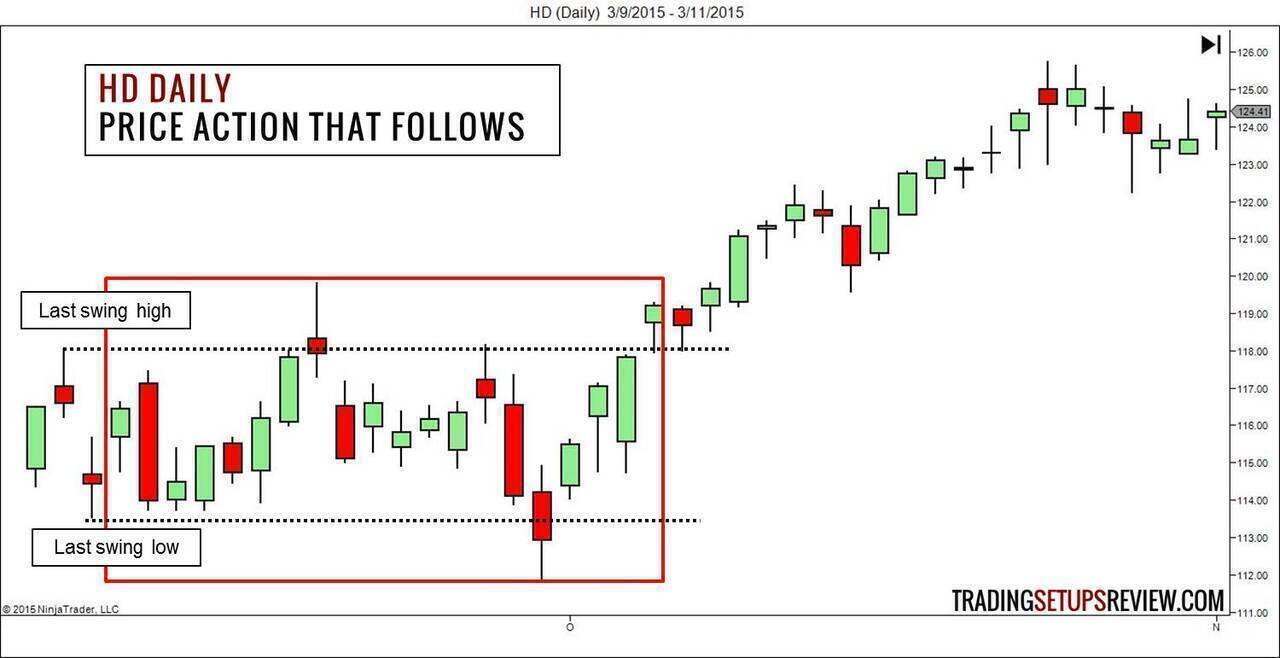
The Price Action that Follows
This red box shows the area we just analyzed. Take a look at how the price action unfolded after that.
Example 2 - CL 3-Minute Chart
In this example, we will look at an intraday chart that shows the 3-minute bars of crude oil futures (CL on NYMEX).
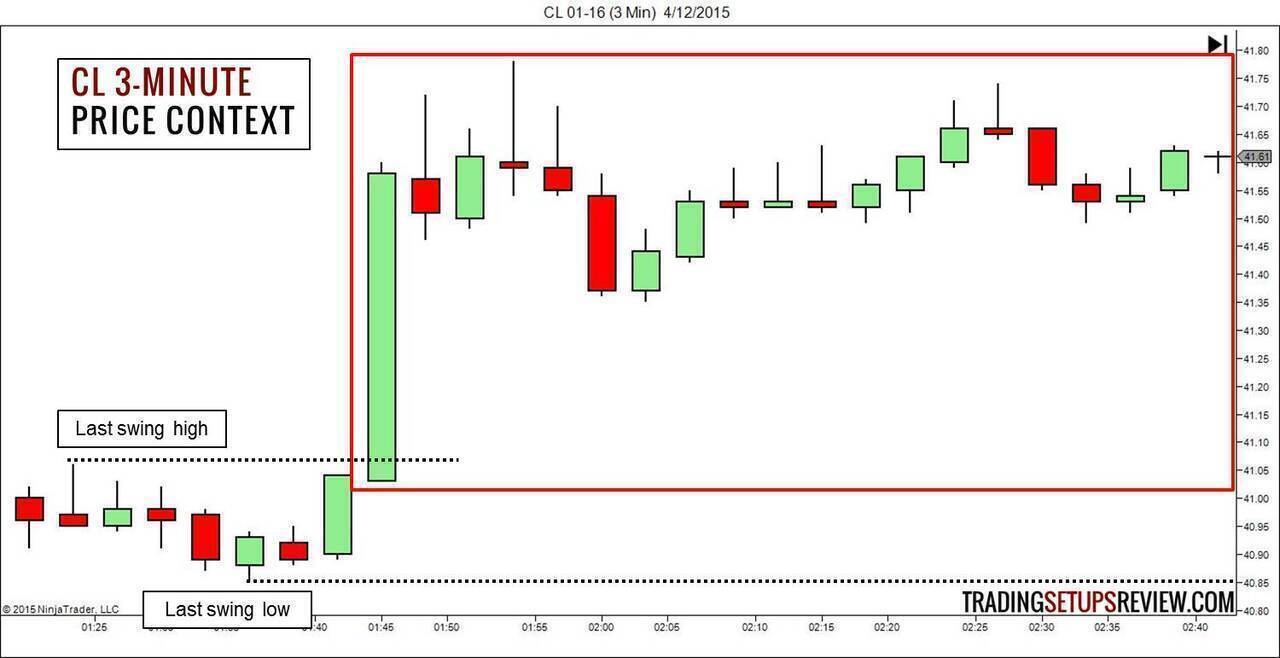
Price Action Context
In the red box, you will see the 20 bars we will be analyzing. The dotted lines mark out the most recent swing high and low just before the area for analysis.
Bar-by-Bar Analysis
The CL analysis is in the chart below. Click on the image to enlarge.
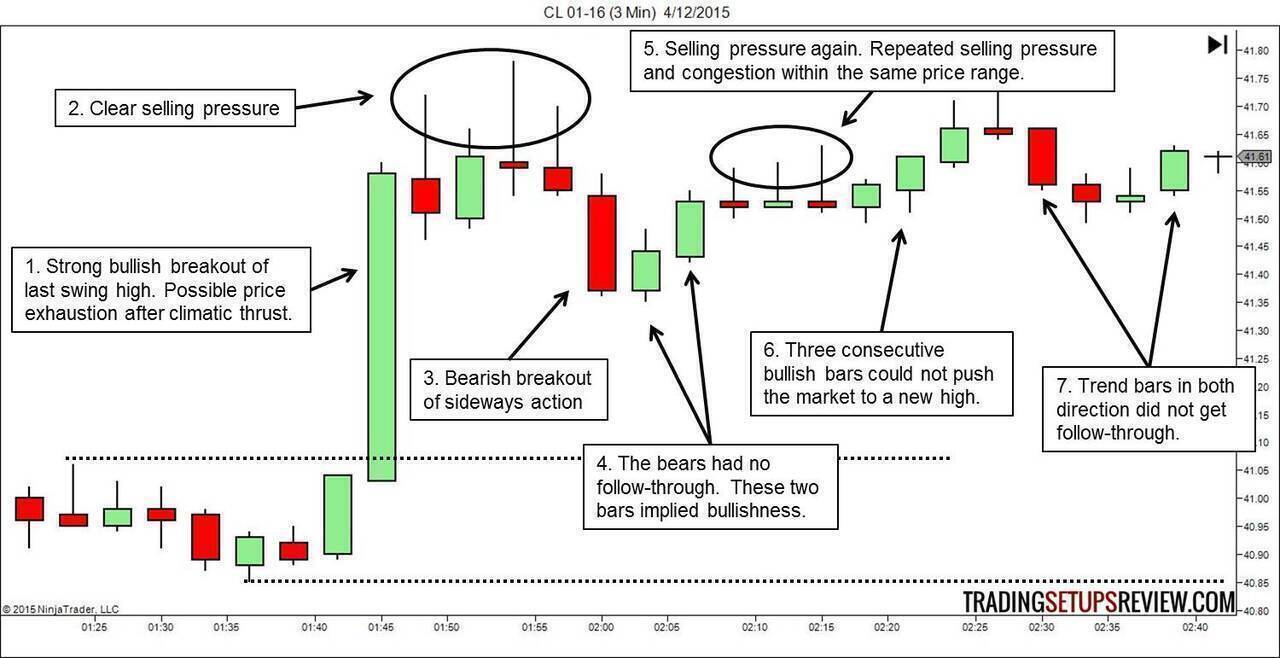
- This bar was a powerful break above the last swing high. The bulls might be exhausted.
- The selling pressure here cemented the idea that the bull run might be over.
- First real attempt by the market to push lower.
- However, the bearish thrust received no follow-through. These two bullish bars implied that the bulls were still in control.
- The top shadows here were significant. They show selling pressure in the same price range where the sellers were found earlier. (Repeated selling pressure within a tight range is a solid bearish signal.)
- This series of three bullish bars was not as bullish as it seemed. Not only did the streak fail to make a new high, the last bar showed a longer top shadow.
- The market was not committed to any direction. Trend bars in both directions did not get much follow-through.
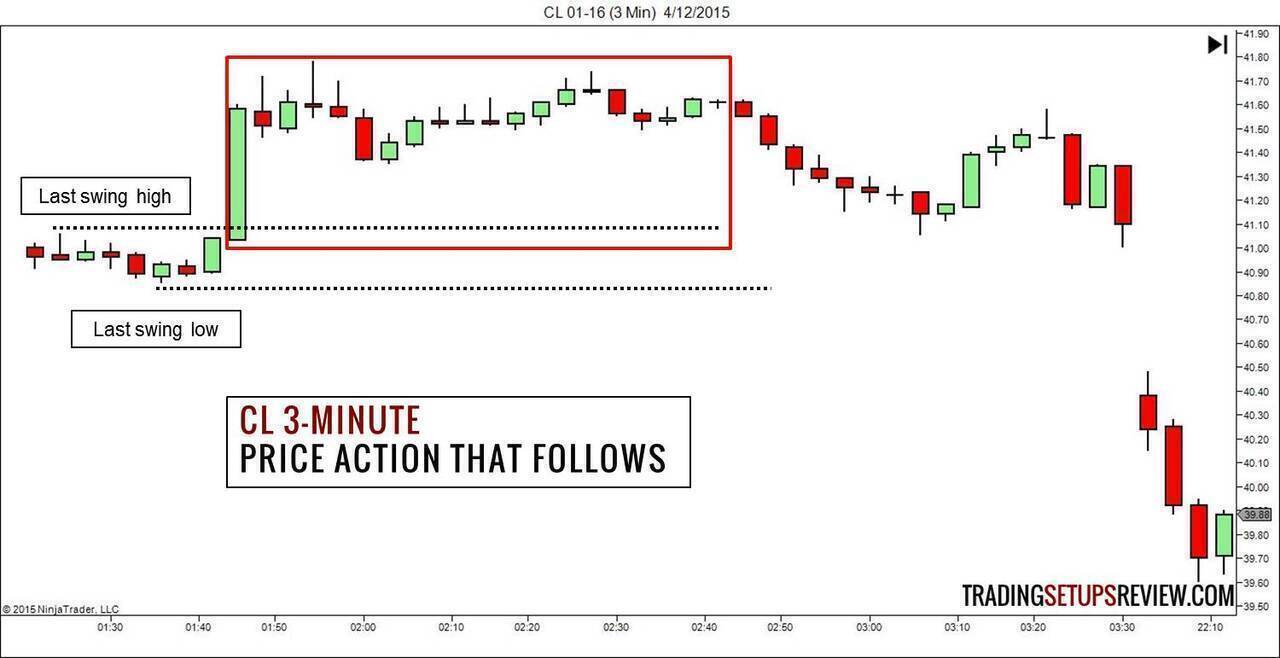
The Price Action that Follows
This red box shows the area we just analyzed. Take a look at how the price action unfolded after that. The chart shows the next 20 bars, which crosses into the next trading session in this case.
Example 3 - 6E 15-Minute Chart
In this example, we will look at the 15-minute chart of the popular forex futures EUR/USD (6E on CME).
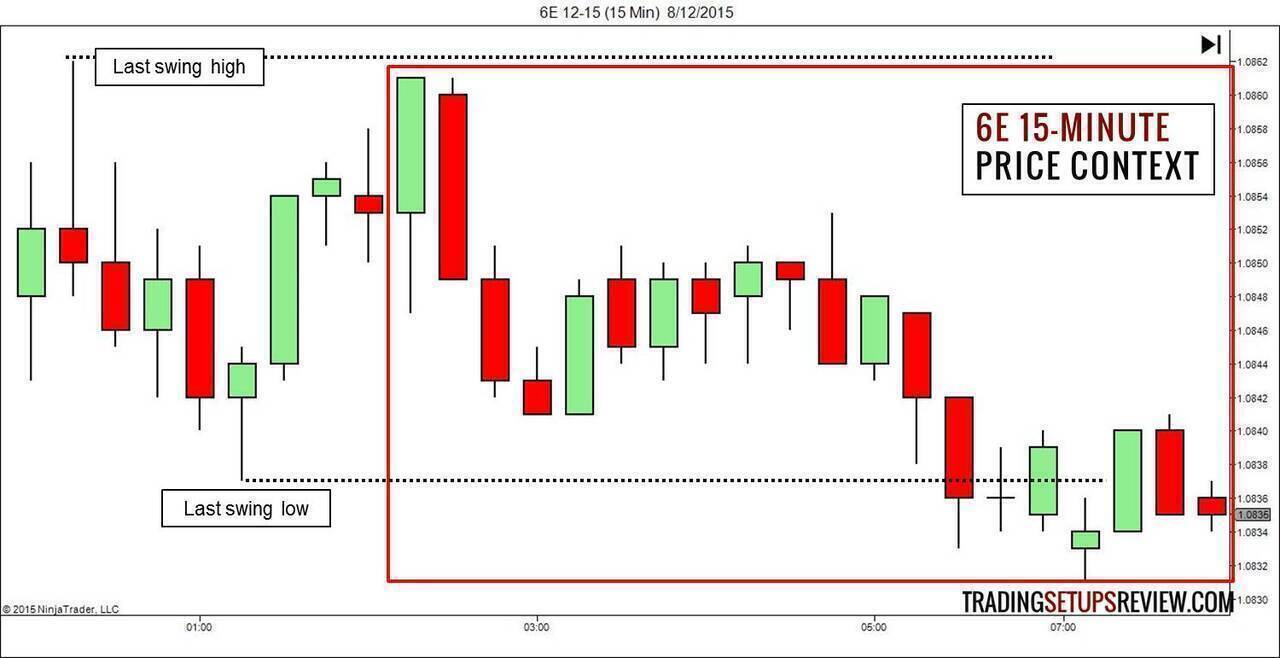
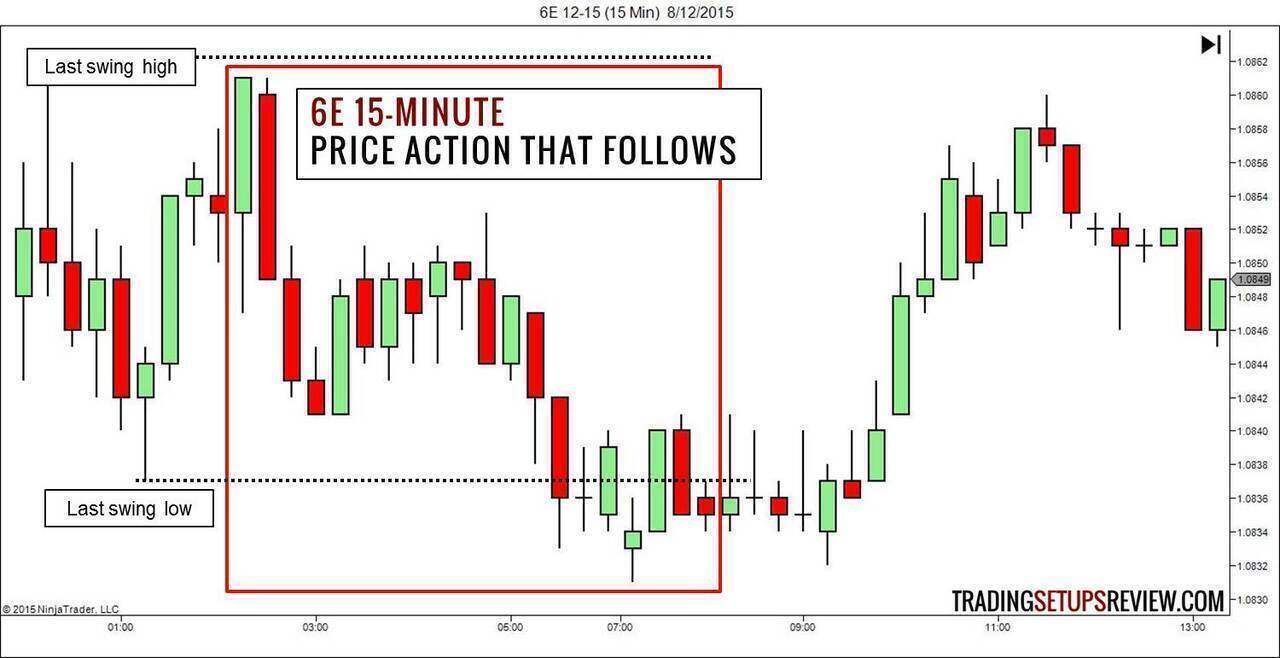
Price Action Context
The red box shows the 20 bars we will analyze below. The dotted lines mark out the most recent swing high and low just before the box.
Bar-by-Bar Analysis
Click on the image to enlarge.
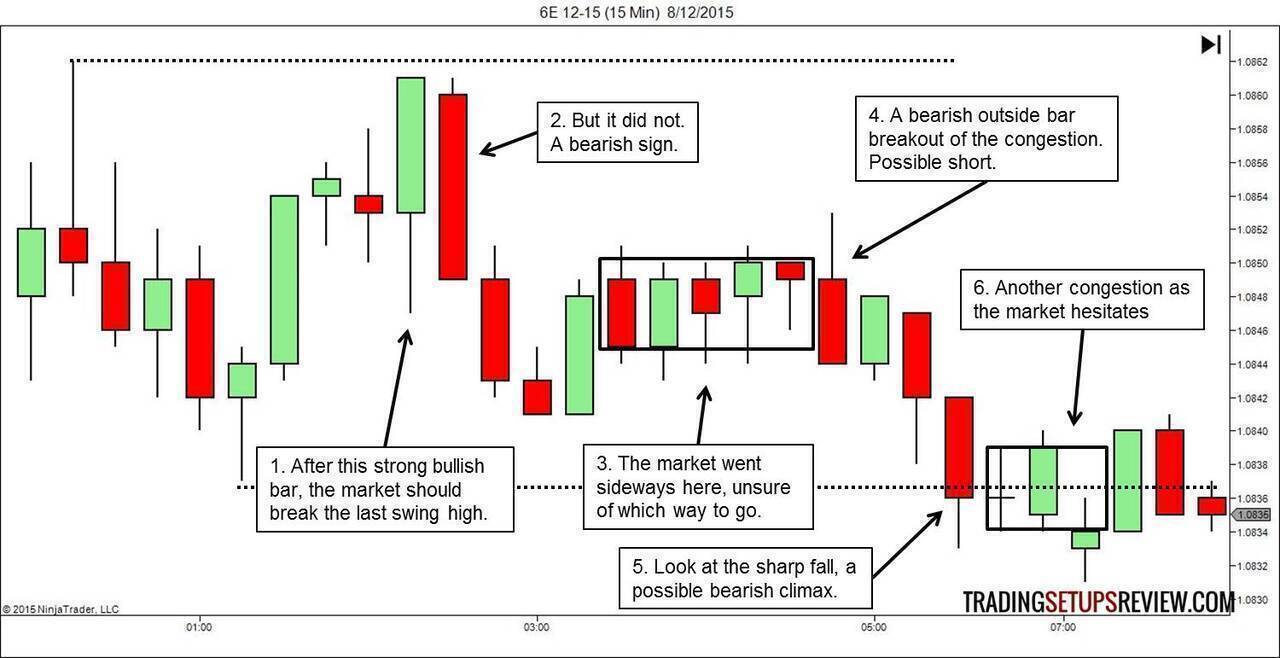
- After this strong bullish bar, we thought that the market would breach the last swing high.
- But it did not. That failure to push to a new high had bearish implications.
- The market fell before drifting sideways.
- This bearish outside bar broke out of the trading range and acted as a bull trap. It was a possible short setup.
- The market fell again with a climatic thrust.
- Another trading range, indicating a pause after the climatic bear thrust.
Price Action that Follows
This red box shows the area we just analyzed. Take a look at how the price action unfolded after that. It confirmed that the last bearish thrust was indeed a climax which preceded a reversal.
Caveats
Limited Analysis
In these examples, I’ve limited the market context to the last set of pivot high and low to keep things simple. I’ve also ignored the finer price action features before the 20 bars.
When you do real analysis, things will be more complex. You need to analyze the market bias by going further back in time. You will certainly need to expand your view beyond 20 bars.
Analysis is not Trading
An analyst is just trying to figure out what happened and what might happen next. A trader needs to figure out how much to risk and target and decide if there’s money to be made.
The examples above demonstrates price action analysis, not price action trading. I did not write down where to enter and exit. But you can certainly find your own trades based on the analysis.
This article is not about trading. It’s about analysis, which is a cornerstone of successful trading.
Conclusion
If you pay attention to price, you will find great value. But it’s a skill that takes time to develop.
I’ve kept these examples simple, so that you can follow them without learning extra concepts.
But if you want to drill down further and ask questions like:
- Why did you label that particular price thrust as climatic?
- Why did you say that these bars form a sideways trading range?
- How did you know that there was selling pressure there?
You can find out more about my price action course here.
That said, you don’t need my course or any other courses to learn how to read price action. The real learning lies with your intense study of price charts.