9 Tools That Trend Traders Can Use to Find Reversals
By Galen Woods ‐ 8 min read
Trend traders who can spot market reversals get ahead. Learn 9 powerful tools, including price action trading methods, to improve your trading ability.
What is your trading strategy for finding the most reliable trend reversals?
As a trend trader, you want to position yourself along with the market trend. A trend reversal is both your entry and your exit.
This is why you must answer this question to the best of your ability. Focusing on finding the best reversals will put you on the path to trading success.
Conversely, each false reversal can cause you to miss potential trading setups. It will also have you scrambling to get back into the flow.
For a trend trader, the power of a multi-pronged approach is very real. With a set of varied tools, you can find reliable trend reversals with confirmation.
This brings us back to one important question: what are the best tools for a trend trader?
Like most traders, you probably have a general idea of how to find a reversal. For instance, you might rely on a moving average.
But, you don’t want to stop there. There are two other things that you need to do:
- Learn about different types of trading tools: price action, technical indicators, and volume tools.
- Appreciate the power of including a variety of tools in your trend analysis.
With that in mind, let’s review nine tools that you can combine to find the best trend reversals as a trend trader.
Price Action Tools
Price action is essential. It is a solid cornerstone of a technical trading strategy.
If price is reversing, nobody can argue with that.
#1: Swing Pivots
For examining price action, you need tools that are practical, simple, and useful. This is exactly what you get with swing pivots.
What are swing pivots?
Open any chart and you will see that price does not move in a straight line. It moves in waves. The start and end points of these waves are swing pivots.
I’ll be the first to tell you that there are many ways to define a swing. At the same time, you should focus on one definition so that you don’t get bogged down with too many choices.
Once you’ve marked swing pivots on a chart, higher highs mean a bullish trend. Lower lows mean a bearish trend.
In this example, I’m using the swing definition taught in my price action trading course.
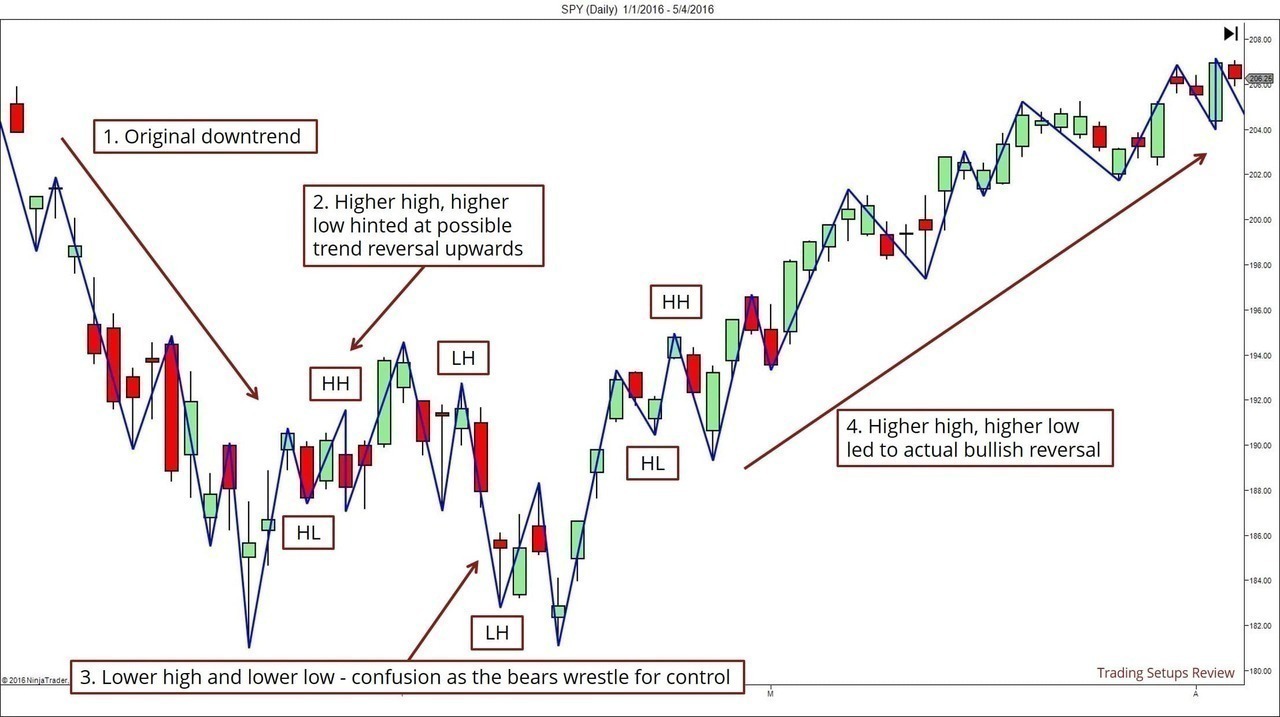
As you can see above, interpreting swings for reversals is not always clear-cut. But with experience, you can use price swings to find areas of potential reversals.
#2: Trend Lines
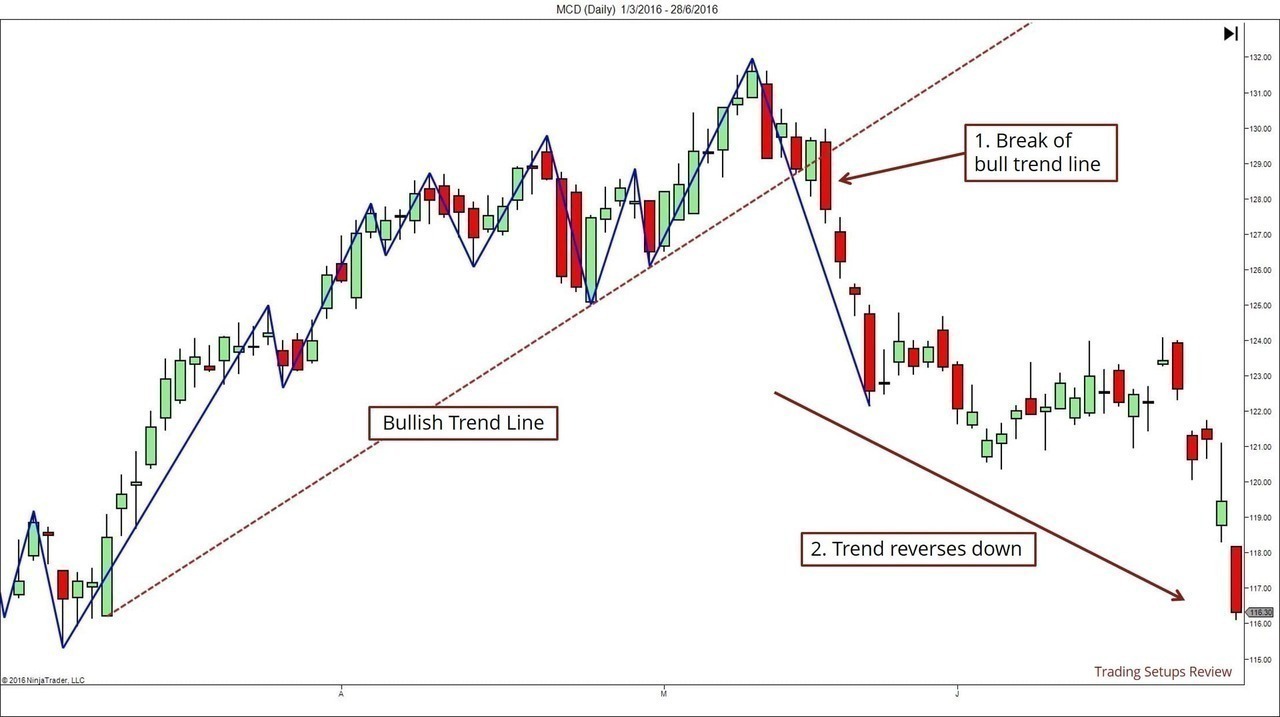
Trend lines are essential to a trend trader’s search for reversals. A trend line defines and tracks a trend.
The basic signal of a trend reversal is when price breaks a trend line.
However, false breaks are common. Hence, the key is the magnitude of the trend line break.
You can draw trend lines by connecting swing pivots. Again, there are many ways of drawing a trend line. But remember that your choice is less important than staying consistent.
Many traders learn by drawing trend lines ex-post on historical charts. It gives the impression that perfect trend lines are easy to find.
Don’t get into that trap. Instead, develop an objective method of drawing trend lines. Once that is done, you can draw them confidently in real-time.
The trend line in the example below is drawn using the method taught in my price action trading course.
Combining swing pivots with trend lines is a great trend trading method. The 1-2-3 reversal is a basic strategy that relies on swing pivots to define a trend reversal.
You can learn more about the 1-2-3 reversal in Trader Vic’s book.
#3: Price Channels
A price channel is formed by extending a parallel line from a trend line.
Most trends go through a channel phase. During that phase, price action bounces between the trend line and the parallel line. (The parallel line is also known as the channel line).
To find reversals with a trading channel, look for overshoots of the channel line.
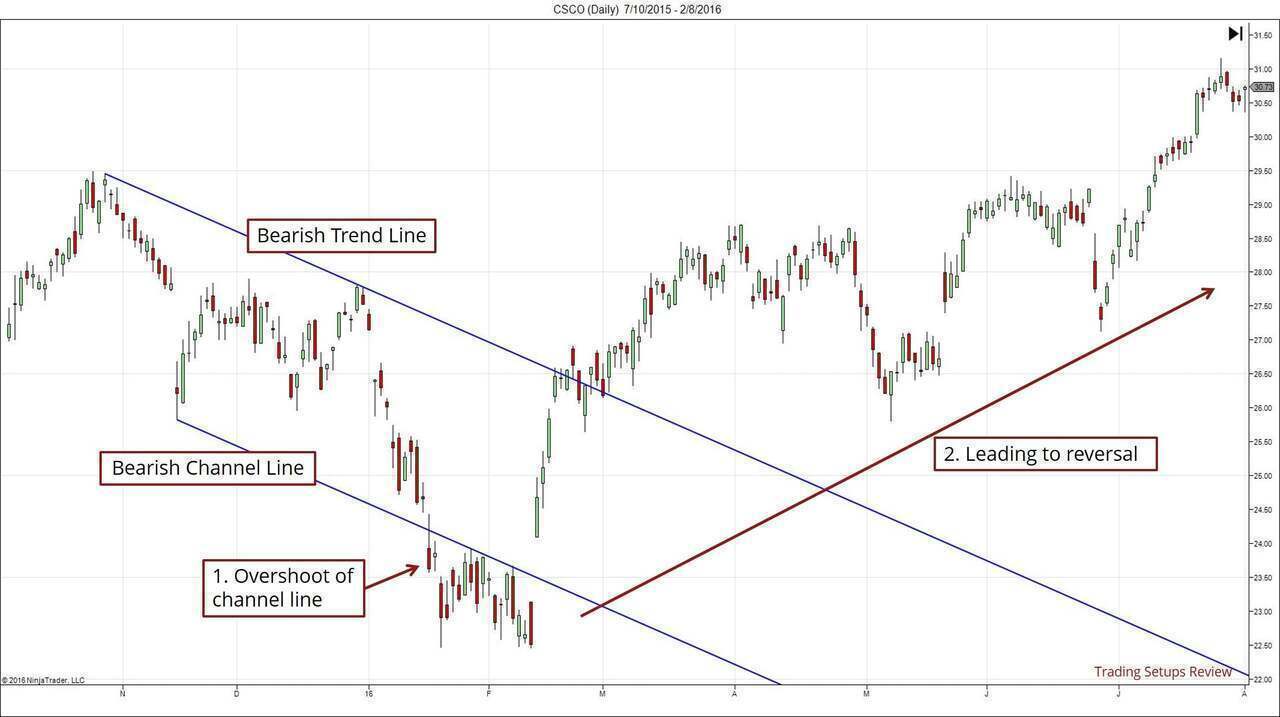
Note that this approach anticipates a reversal. It is unlike the trend line strategy above which waits for a trend reversal to take place.
If you are an aggressive trend trader, this price action tool is for you.
A balanced approach is to start with watching for channel overshoots as a warning. Then, look out for a trend line break as confirmation.
Technical Indicators
While price action is useful, indicators can also help trend traders in finding reversals.
Technical indicators are also suitable for tracking a large set of instruments. You can easily set up clear criteria to scan for potential reversals.
#4: Moving Average
A trend trader can also find reversals with an intermediate to long-term moving average.
My preferred method of using a moving average is by observing its direction.
![]()
The strength of moving averages is that you can use a few of them to track trends of varying degrees.
However, apply too many moving averages and you’ll turn this strength into a drawback.
If you are just starting out, consider the 50-period moving average. For tracking shorter trends, you might want to use the 20-period moving average.
#5: Donchian Channel
This is the indicator used by the famous Turtles.
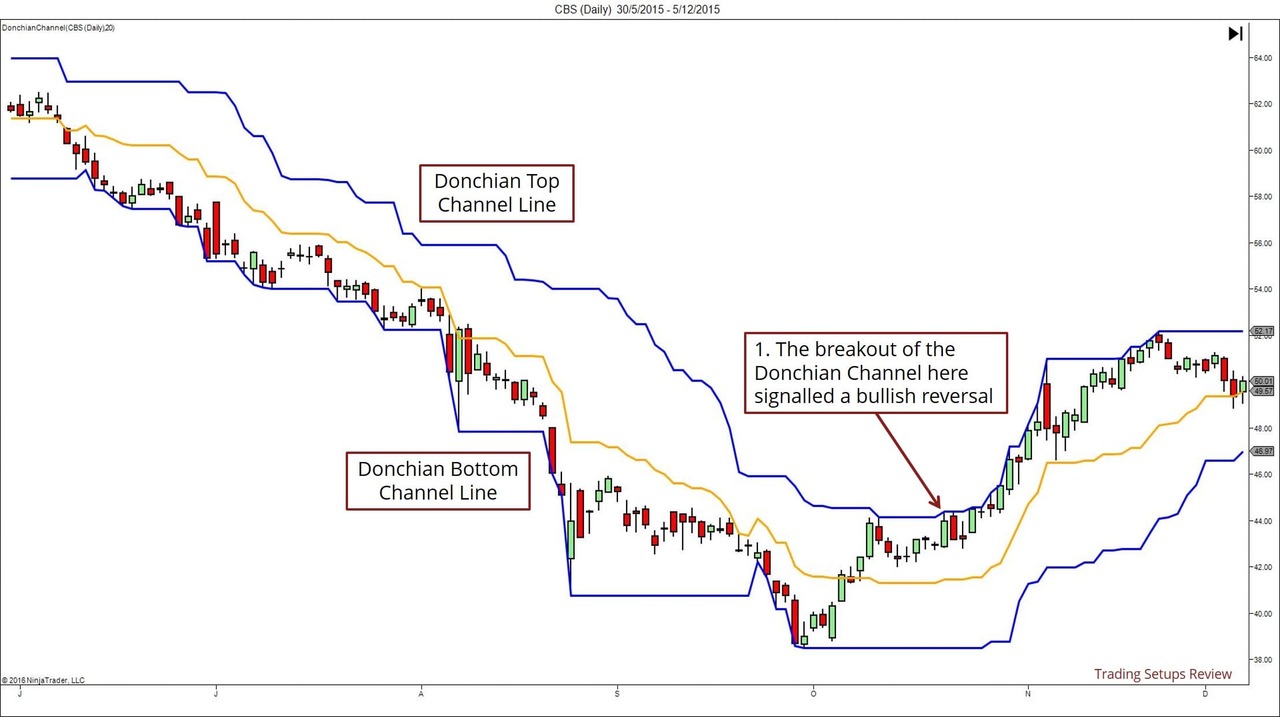
The original strategy’s profitability might have been eroded, but the Donchian Channel maintains its status as a powerful trend tracking tool.
In fact, the Donchian Channel is grounded with price action. It’s not your typical indicator with hard-to-grasp formula.
The Donchian Channel has two lines. They are the highest price and the lowest price attained within the lookback period.
This means that it is simply defining a price range using historical price action.
Let’s take a look at the Donchian Channel in action.
Refer to this free PDF for a detailed explanation of the Turtle trading approach.
#6: Moving Average Convergence Divergence (MACD)
As a trend strengthens, two moving averages of different periods will diverge. As a trend weakens, two moving averages will converge.
This is what Gerald Appel observed and used as the basis for the MACD indicator.
For trend traders, an impressive use of the MACD is for finding price divergences. A price divergence is a powerful reversal signal. It occurs when price and an oscillator disagree.
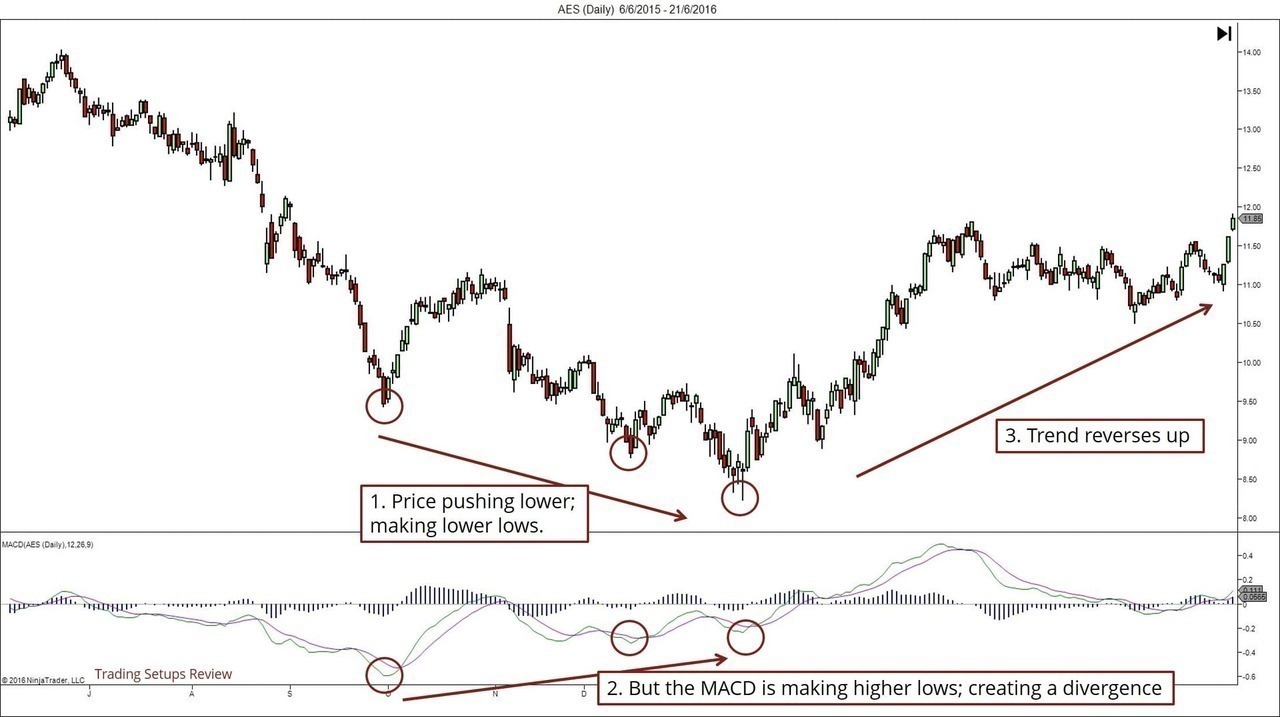
Technically, you can define a price divergence with two points. However, using three points like in the example above improves the quality of the setup.
Volume Tools
Volume are important confirmation tools.
However, as they do not relate to price action directly, they tend to give early signals that might be less reliable.
Nonetheless, when used correctly, they give the trend trader a chance to enter the market before everyone else.
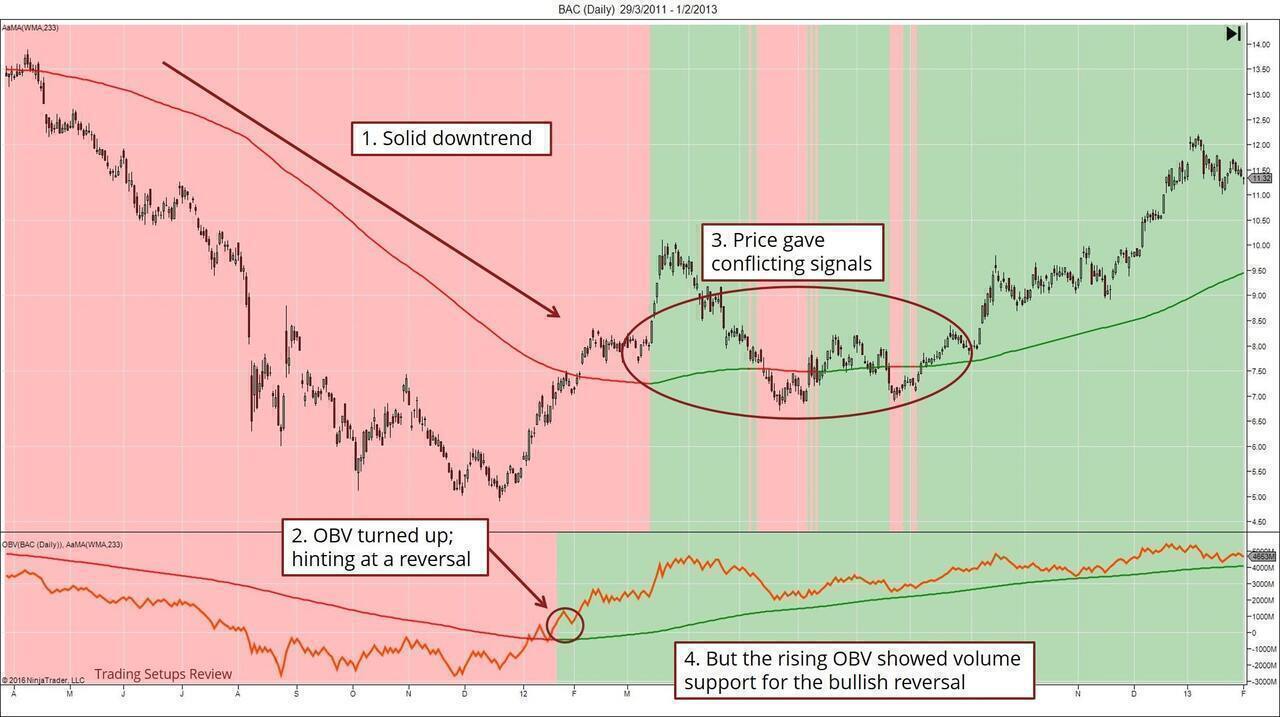
#7: On Balance Volume (OBV)
OBV is a cumulative indicator. It means that its value does not depend on a lookback period. It increases and decreases according to the polarity of each price bar.
The key implication is that you should ignore its values, and focus on its direction.
If both price and OBV are rising, the bullish trend is solid. Once the OBV starts to lose steam, a trend trader might sense danger. A reversal might be impending.
I like to observe the OBV through a long-term moving average of its values. A moving average helps to highlight the trend of the OBV, which is as important as the trend of the market.
In the example below, the background colour shows the slope of the OBV moving average. (green means up and red means down)
To learn more about trading with OBV, take a look at this article.
#8: Volume Oscillator
The Volume Oscillator is a handy tool but you must be careful. As it is based on volume, you must interpret it differently from price oscillators like MACD and RSI.
Positive values do not mean that bullish prices are supported. They mean that the trend, in either direction, is healthy. Negative values mean that the trend is weak.
With this knowledge, trend traders can also use divergences to find potential reversals.
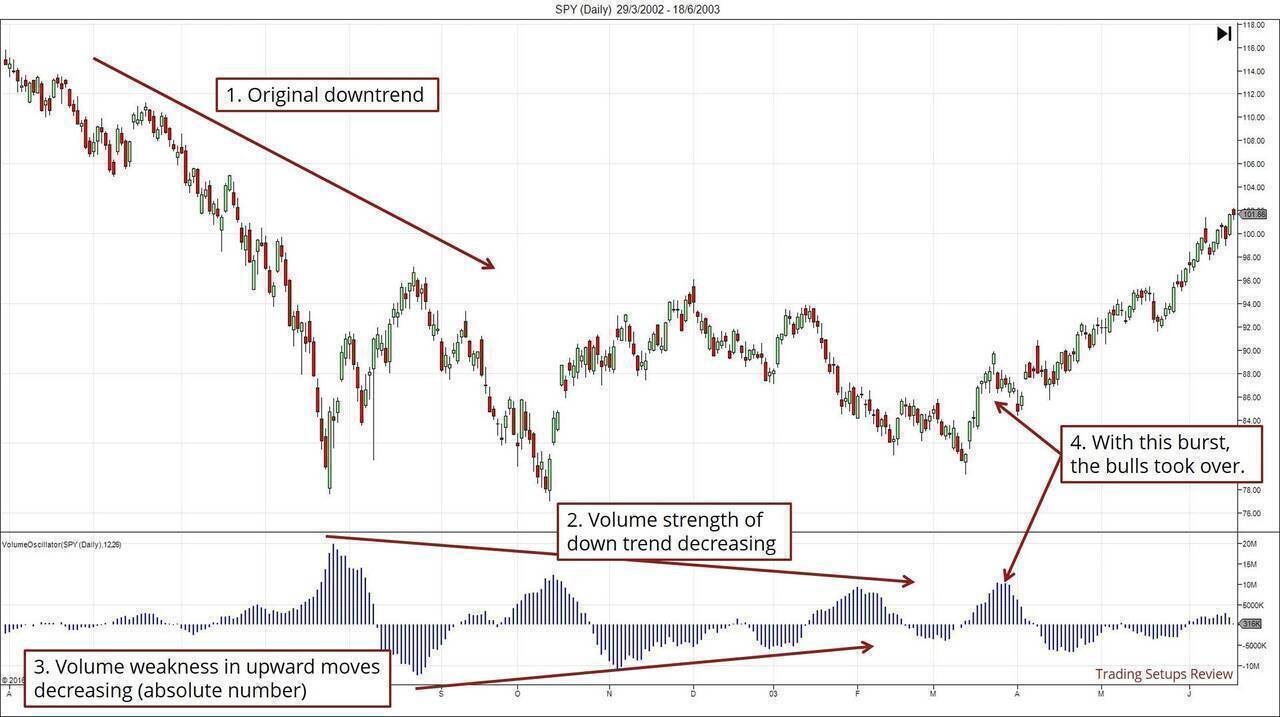
Using the Volume Oscillator well is more challenging than applying price oscillators. Practise more and you will be well-rewarded with a volume perspective to price action.
#9: Volume Extremes
Extreme volume is a sign that the trend might have run its course.
In a rising trend, sudden extreme high volume might be the result of climatic buying. Climatic buying implies that all the buyers have bought. When there are no buyers left, the market can only go one way - down.
The same logic applies in a falling market. Climatic volume might have taken out all the sellers. Then, when there’s no more sellers, the market can only rise.
You can spot extreme high volume bars in retrospect easily. However, in real time, you might hesitate in deciding how high is high.
To solve this problem, you need a more objective method to determine if volume is high. One way is to use Bollinger Bands applied on volume data - orange line in the chart below.
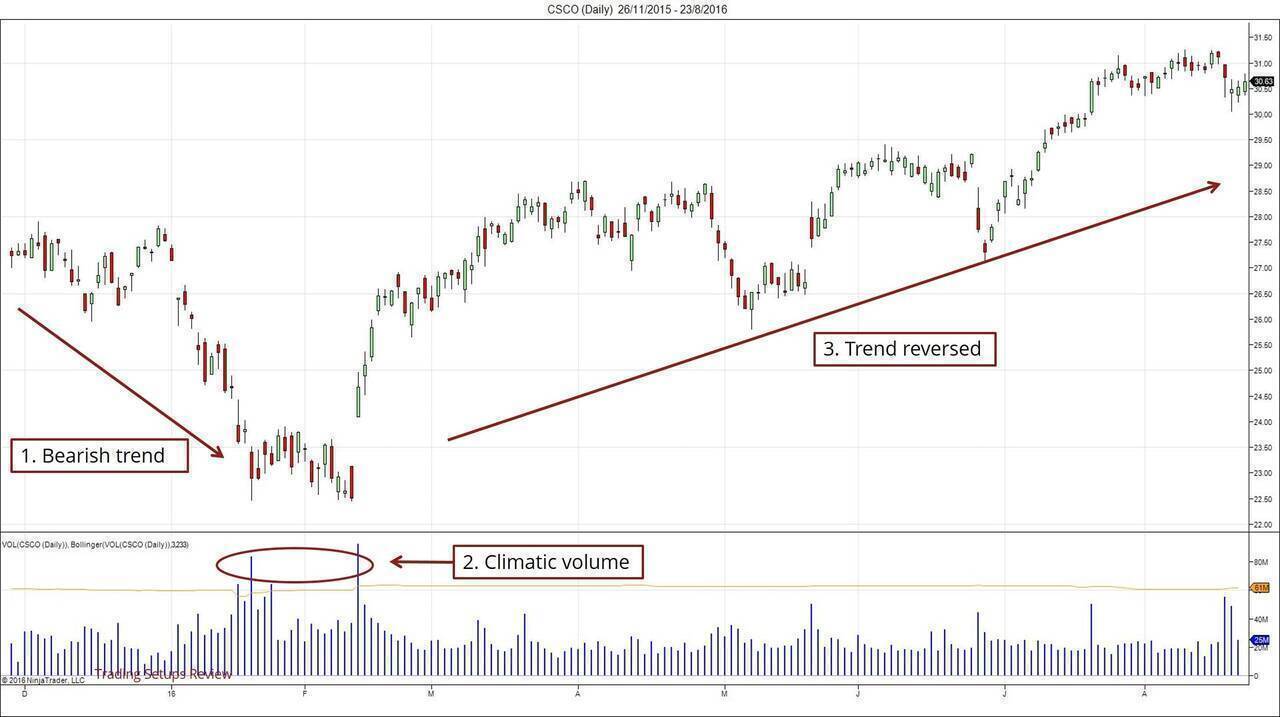
Extreme high volume also helps to define reliable support and resistance levels.
Conclusion - Tools for Trend Traders
As a trend trader, you appreciate the importance of reliable reversal signals. But that’s only half the battle.
If you’re going to look for reversals, you should use an arsenal that includes both price and volume.
Also, don’t throw indicators out of the window. Instead, learn to use them prudently with price action as your beacon.
As you’ve learnt, some tools anticipate a reversal while other confirm a reversal. While no tool is flawless, you can use them to your advantage.
For instance, you can put on a small position based on the anticipation of a reversal. Then, increase to your full position once the reversal is confirmed.
Spotting reversals is one of the toughest but most rewarding trading approach. This is why a trend trader needs the best tools available.