6 Top ADX Indicator Trading Strategies
By Galen Woods ‐ 4 min read
The Average Directional Index or ADX is a unique trading indicator that tries to deduce if a market is trending. Learn 6 effective ADX trading strategies.
J. Welles Wilder was a prolific designer of trading indicators that have survived the test of time. With his broad experience with the markets, Wilder knew that the key to trading is getting the context right.
But how do you evaluate the context? Wilder’s answer is the ADX indicator.
Wilder designed the Average Directional Index (ADX) as an indicator to interpret market context. Essentially, it informs you of the market’s trendiness.
These six trading strategies will give you a rounded view of how the ADX works. They will also show you how it performs with other common trading tools.
You should already be familiar with the ADX to follow the strategies below. If you have never heard of this indicator before, click here for a short primer by Investopedia before proceeding.
- ADX in the DI System
- ADX with the Parabolic SAR
- ADX versus ADXR
- 2-Period ADX
- The Holy Grail
- ADX Price Divergence
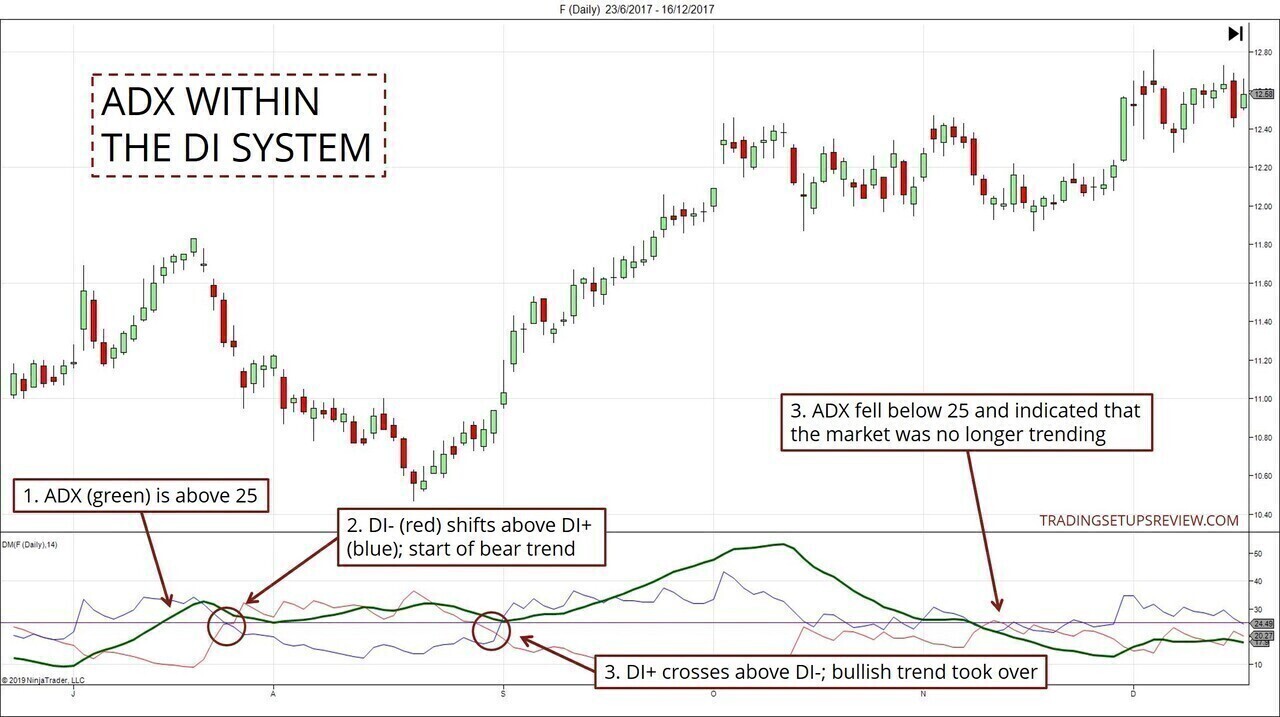
#1: ADX Within the Directional Movement (DM) System
While the ADX is a useful tool on its own, it was a standard part of Wilder’s DM System.
The DM system has three lines:
- ADX measures the strength of the trend.
- DI+ measures bullish movements.
- DI- measures bearish movements.
The following interpretation is valid only if the ADX is above a threshold (commonly set at 20 or 25):
- Bullish: DI+ > DI-
- Bearish: DI- > DI+
This system is a basic setup. Do not expect it to be profitable without refining it with other tools like price action and volume.
For more examples, take a look at TraderHQ’s article on the DI system.
#2: ADX with Parabolic SAR
Now, this second strategy builds on the DM system.
At times, you’ll observe that the price action disagrees with the ADX. Under such situations, relying on DI crossovers for entries might not make sense.
According to Wilder, you can get a better entry if you use the system in conjunction with the Parabolic SAR.
How it works:
- Use the DM system to establish your market bias.
- Look to Parabolic SAR for trade triggers.
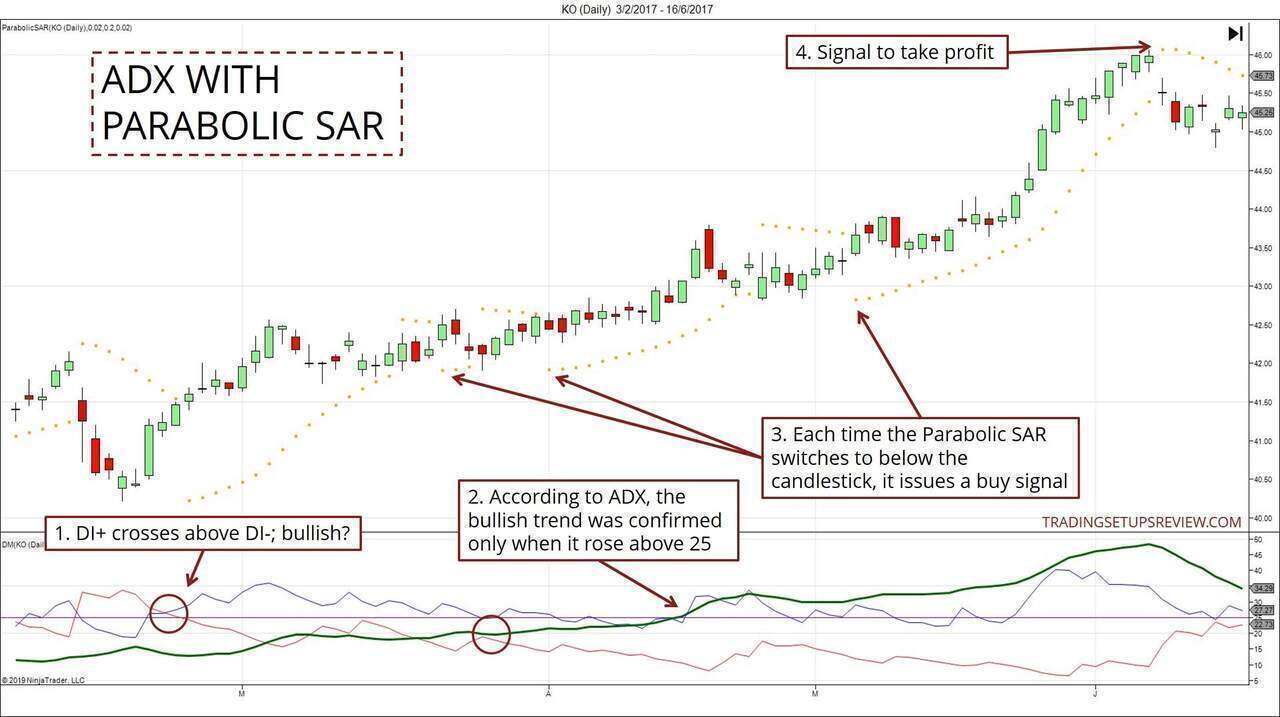
As you can see (in Point 4 above), when you get a nice parabolic swing, the Parabolic SAR can even guide your exit from the market.
You can find more examples in this article by FX Trading Revolution.
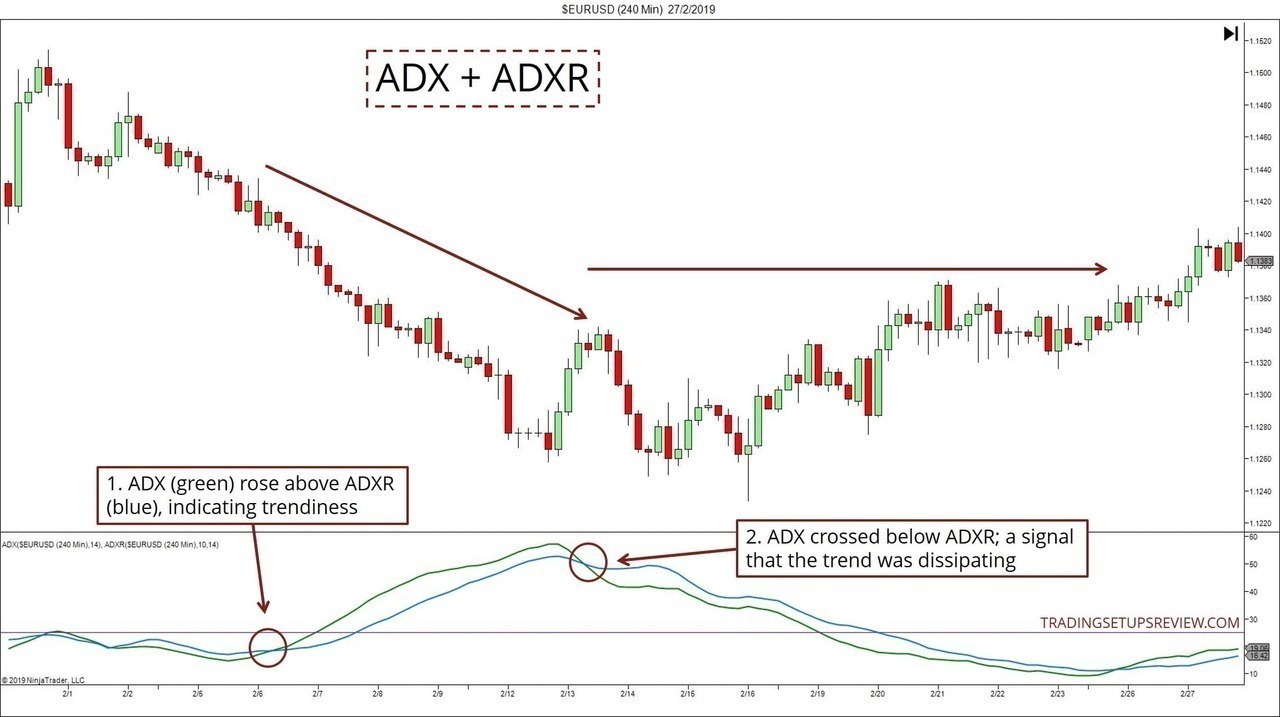
#3: ADX and ADXR
The ADXR is a smoothed ADX.
While it’s not a trading strategy per se, it’s a tool for finding more conservative signals. In any approach that uses the ADX, you can opt to replace it with the ADXR. This substitution will filter out the more aggressive signals.
Another way to deploy the ADXR is to plot it together with ADX.
Then, based on their crossovers, you can judge if the trend is gaining momentum or if it’s weakening. It offers earlier signals than observing only the ADX.
This concept is similar to the ADX slope method discussed here.
#4: 2-Period ADX Strategy
Earlier, I spent some time investigating the behavior of common indicators with extreme parameters. The study led to the development of this 2-period ADX strategy.
Here, we are not using it to find trends. Instead, we apply it to find imminent breakouts like the one shown below.
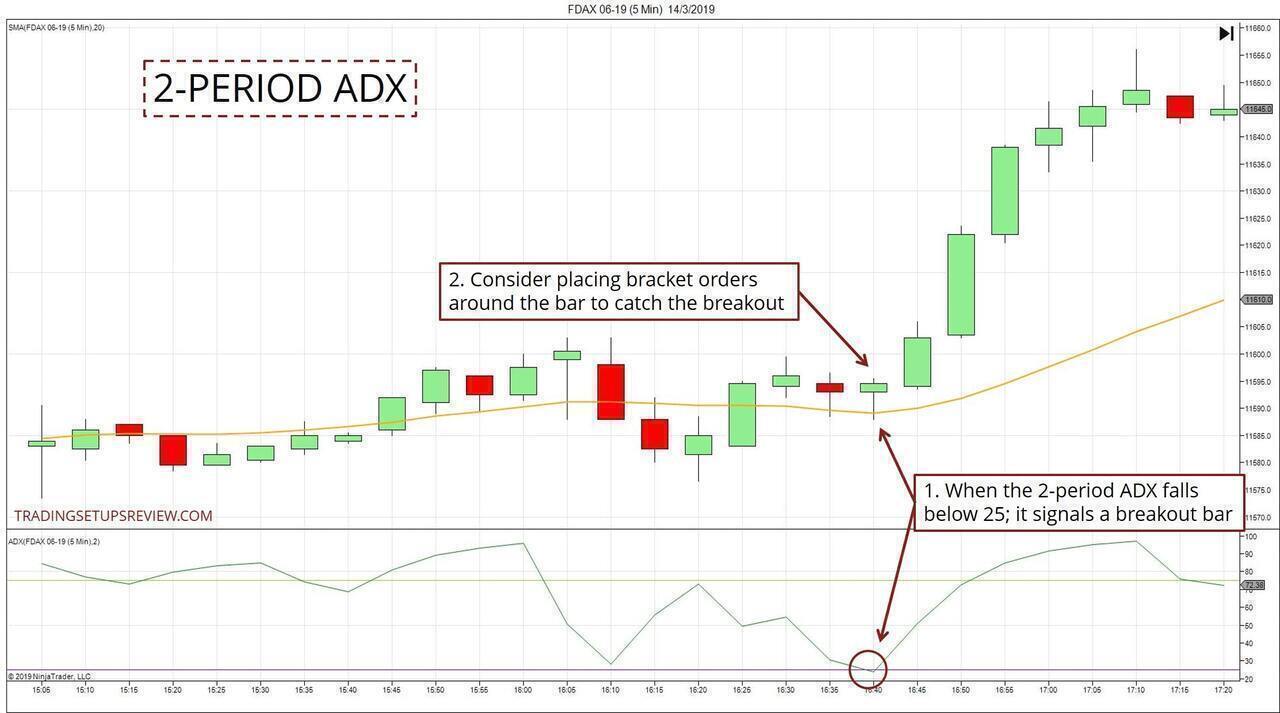
Click here for the full write-up on the 2-period ADX.
#5: The Holy Grail
A classic strategy from Linda Bradford Raschke. The Holy Grail combines the ADX with a moving average to find pullbacks using price action.
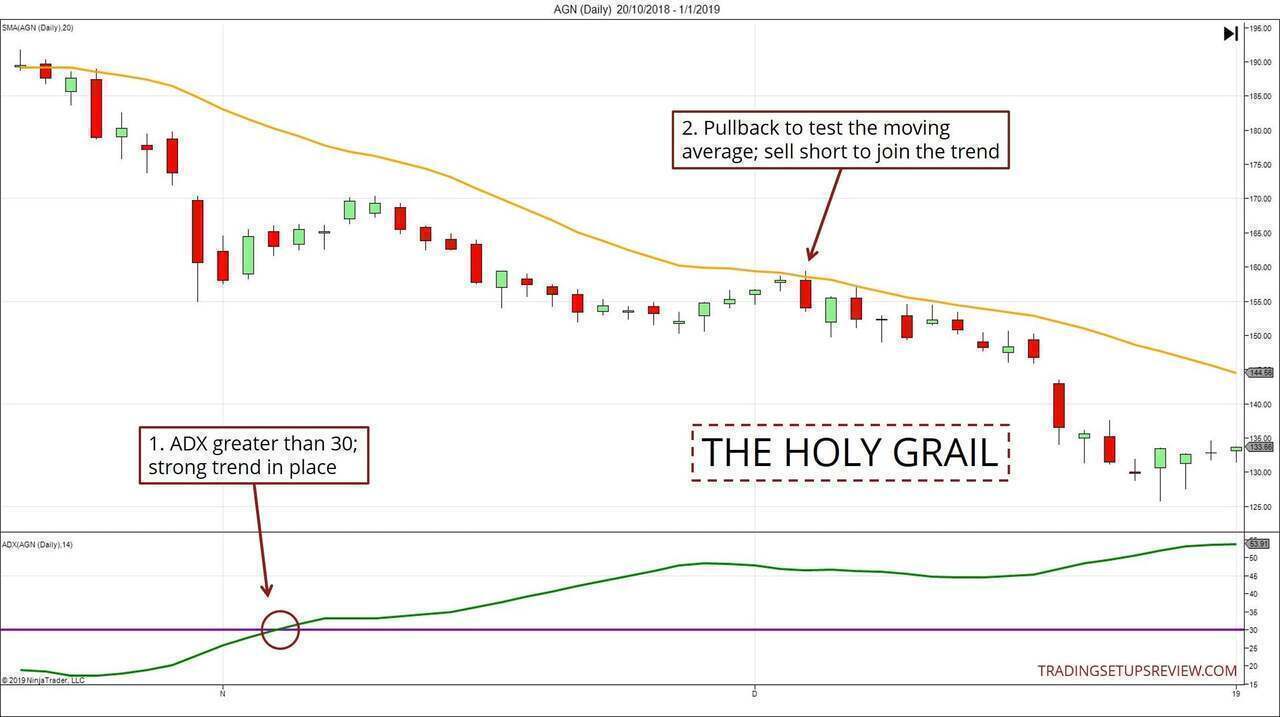
For more chart examples, refer to our review of the Holy Grail strategy.
#6: ADX Price Divergence
In this strategy, the fundamental intuition is that as a trend develops, the ADX value should rise.
But what if the ADX is falling instead? What does that mean?
This divergence means that the ADX is issuing a warning against the trend.
It is similar to the divergences you see in oscillators like the RSI and MACD.
However, one crucial difference is that the ADX is not directional on its own. This attribute directly affects how you look for ADX price divergences.
I find that ADX divergences work better if the first ADX crest is above 40. Hence, I’ve set the chart below to show the 40 value line.
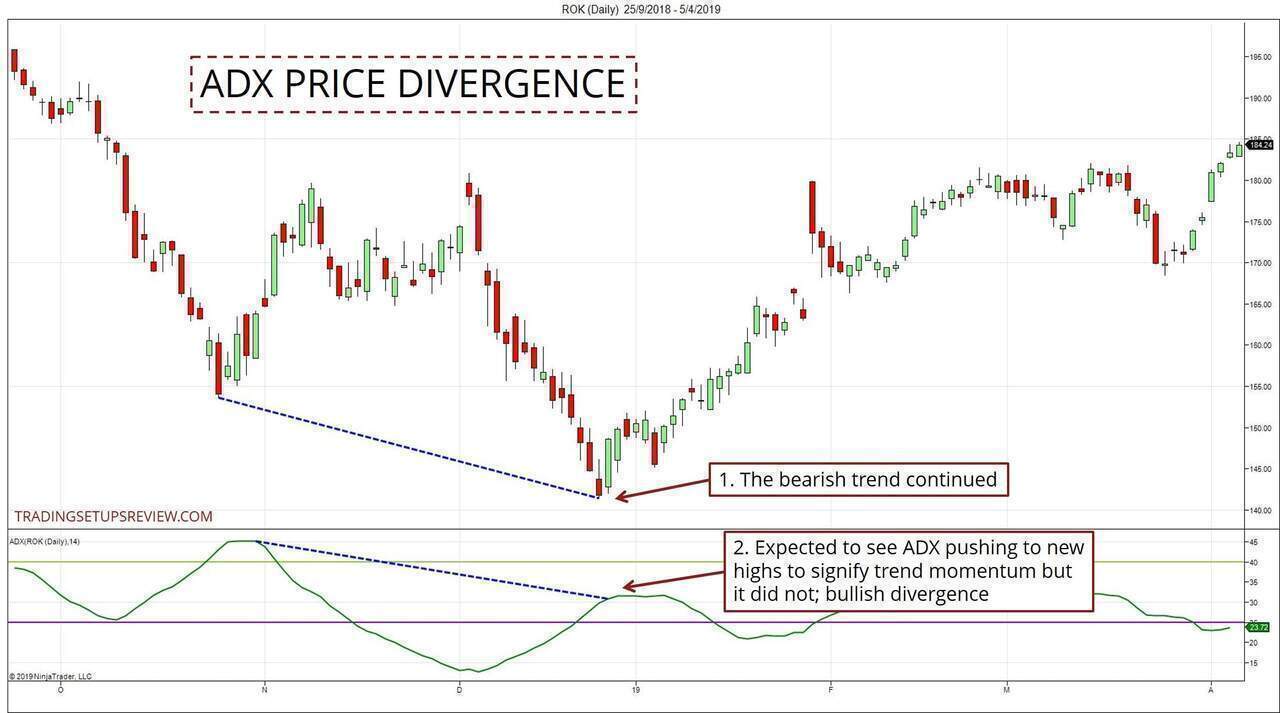
This chart shows how the ADX formed lower highs as the bearish trend continued. These lower highs implied that the bearish trend might be losing momentum.
You can find another example of ADX divergence in the last chart of this article by Brandon Wendell.
Conclusion
There you go. Six strategies for ADX users.
These strategies should give you a solid foundation for analyzing the market with the ADX. But if you want to go straight to the source, read Wilder’s New Concepts in Technical Trading Systems.


Beyond these setups, as a price action trader, I find the ADX helpful in market scans.
For instance, through a scan, the ADX points out trending markets. It provides a short list for me to zoom in to perform detailed price action analysis.