3 Practical Day Trading Indicators
By Galen Woods ‐ 6 min read
These day trading indicators are simple but effective. They can help to identify trends, entries and exits, forming a solid package for any day traders.
With the dozens of trading indicators out there, it is a Herculean task to read and learn about them one by one. It’s more efficient to go ahead and get started with chart analysis using a few simple but practical indicators. After grasping the basic concepts and indicators, you can easily pick up more indicators if you wish to.
Hence, this guide introduces an intraday trading starter pack with three useful trading indicators.
Intraday Trading Indicators
So what’s in our intraday trading indicator starter pack?
Just three trading tools:
- Donchian Channel
- Moving Average
- Stochastic Oscillator
Why these three indicators?
- The Donchian Channel relates strongly to price action. In fact, its construction involves only logical comparisons and no calculations.
- The moving average is one of the most versatile indicators for analyzing price action.
- The Stochastic Oscillator represents a different class of indicators that tracks momentum instead of the trend.
Like all trading tools, they are not perfect. But they are straightforward, easy to understand, and useful for day trading. With these characteristics, they form a neat package.
Indicator #1: Donchian Channel (Blue)
The Donchian Channel takes its name from Richard Donchian, a pioneer of trend following systems.
- This channel plots the highest high and lowest low of the most recent N bars.
- An average of the two values is also calculated and plotted as the mid-line.
Donchian Channel shows you where the market is now, compared to its past, in a handy and visual way.
The Donchian Channel is useful for day trading as you can use it to keep an eye on the larger time frame.
The chart below shows an example across several trading sessions. The vertical lines divide the trading sessions.
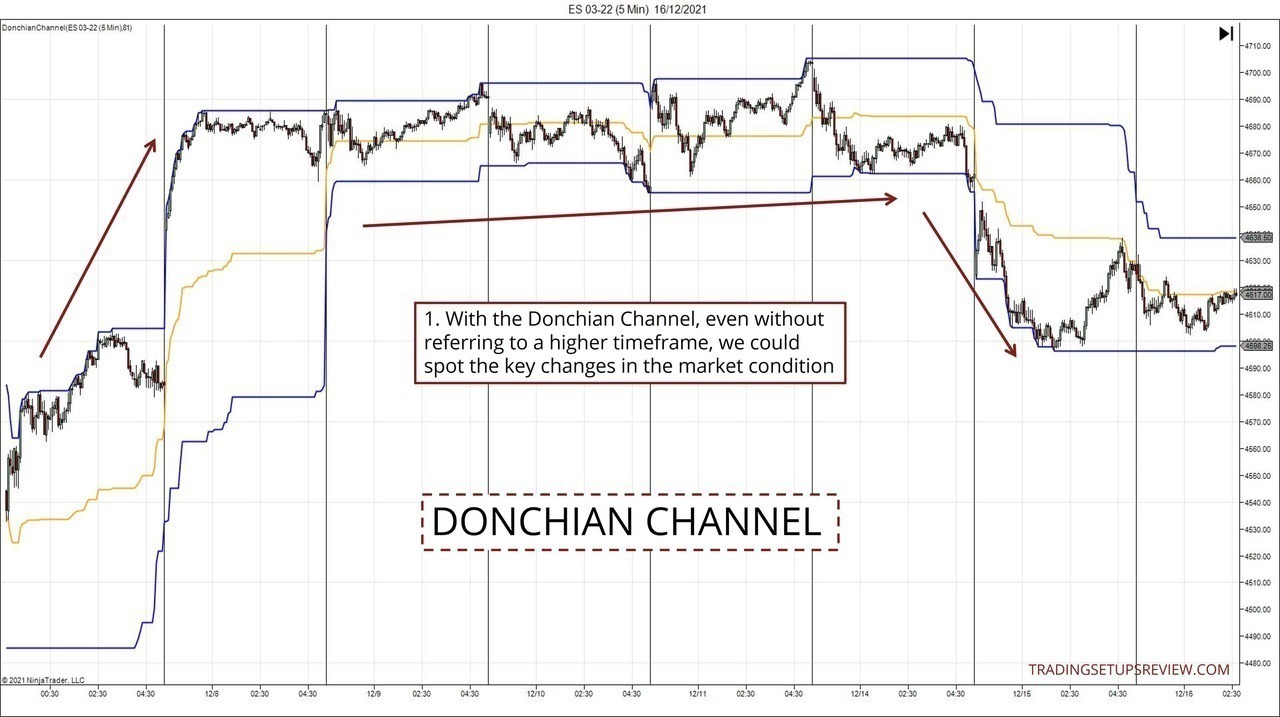
- With the Donchian Channel, we can easily track the market condition (ranging, uptrend, downtrend) across multiple sessions. In addition, it offers an informative picture of where the market stands with respect to recent price action.
You can use a 100-period Donchian Channel to keep you aligned with the longer-term trend.
Alternatively, count the number of candlesticks in one session, and use that count as a basis for your channel’s lookback period.
For instance, you count 81 candlesticks in one session. You can use that as your Donchian Channel lookback period to track the recent trend. You can also multiply that count by 5 to keep track of the weekly trend.
Indicator #2: Moving Average
The moving average is a primary indicator and is probably the first indicator you encountered as a technical trader.
A standard N-period moving average is the average of the past N number of candlestick closes. As new candlesticks close, the moving average will move along, dropping the oldest closing price and including the latest closing price in its calculation.
How do you interpret a moving average?
- The direction of the moving average highlights the price trend.
- The space between price and the moving average highlights momentum.
This simple indicator packs a punch if you know how to use it.
There are dozens of moving average flavors, and you might be tempted to go for exotic options with their numerous touted enhancements.
However, I recommend starting with the simple or exponential moving average to get a firm foundation of how moving averages work.
The chart below shows the price action across two sessions and contains a 20-period simple moving average (SMA).
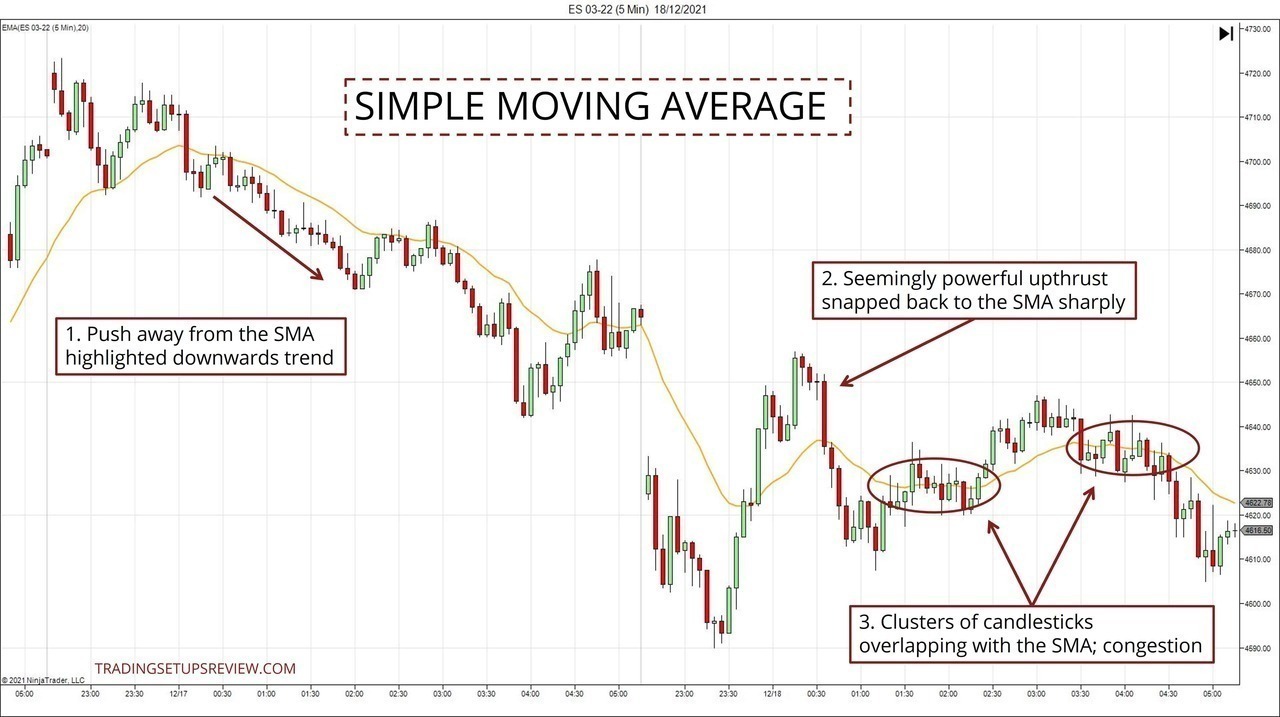
- When the market steers clear of the moving average consistently on one side, it is a clear sign of a trending market. Here, the market stayed below the SMA for a long series of candlesticks.
- On the other hand, in a ranging market, thrusts away from the moving average are unsustainable, and sharp snaps back to the SMA are expected.
- Finally, a moving average also helps to identify price congestion. Stay alert to consecutive candlesticks that overlap with the moving average.
As you can see, if you observe how price action interacts with a moving average, you’ll find that even a simple moving average offers a lot of value.
Indicator #3: Stochastic Oscillator
George Lane’s Stochastic oscillator is a popular day trading indicator.
Its working logic is like that of the Donchian Channel in the sense that it measures the current market position relative to the market’s past trading range.
However, it goes further and assumes that the market is in a trading range. Relying on this assumption, it turns that measurement into an oscillator that moves between 0 to 100. Then, the convention is to watch out for levels above 70 and below 30 as signs of the market being overbought and oversold, respectively.
The result is a sensitive and responsive momentum indicator, making it suitable for pinpointing day trades.
Recommended settings:
- %K period: 5
- %D period: 3
- Smoothing period: 3
(If you want to play around with different settings, check out this discussion on the factors to consider.)
The chart below shows the Stochastic oscillator at work, highlighting multiple signals and divergences.
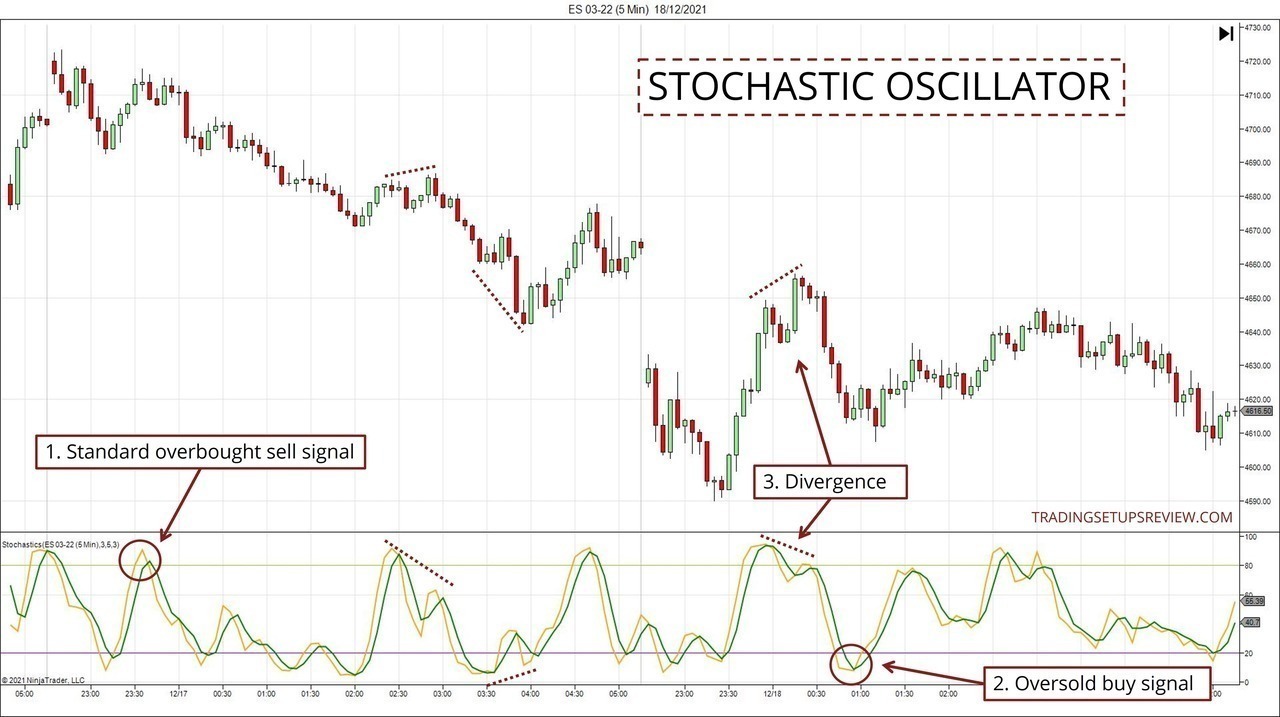
- This is a standard overbought signal that you can use for timing a short entry.
- This is the oversold buy signal. However, like the overbought signal, these signals should form part of a holistic market approach and not be traded in isolation.
- There are three divergences marked in this chart (dotted lines). Depending on your market bias and current position, you can use these divergences as entries or exits.
If you’re interested in the Stochastic indicator, be sure to check out Kane’s %K Hooks strategy. It is a multiple time-frame day trading strategy that uses the Stochastic oscillator.
Putting Them Together
This final example will look at how the three indicators work together in a day trading plan.
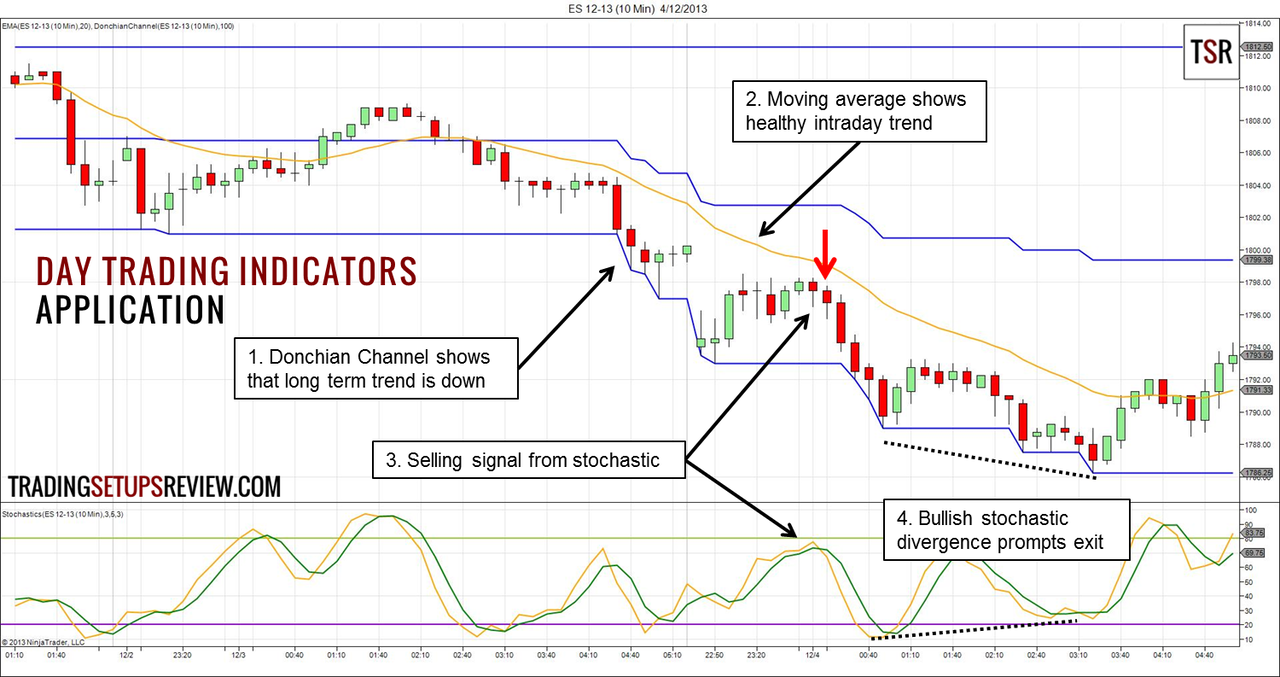
- The market pushed below the lower Donchian line, implying that the long-term trend was bearish.
- The moving average sloped down, signaling a steady intraday trend. It also confirmed the bearish bias.
- This was a possible short signal from the Stochastic indicator. In theory, it was not the best signal as the Stochastic was not at overbought levels, but if the context is proper, such signals are acceptable.
- This Stochastic bullish divergence served as an exit prompt here.
This example demonstrates how these indicators can work hand in hand. However, this is not a definitive trading strategy.
I highly recommend that you study each indicator separately and observe how they help to clarify price action. From there, with your observations, you can form a trading approach that works for you.
Day Trading Indicators - A word of caution
Above, we discussed three fundamental indicators. Now it’s time for three warnings against them.
- Indicators are not perfect; spend time practicing with them to understand when and how to use them.
- Do not neglect price action when trading with indicators. Instead, consider using price action patterns to improve your analysis. (Like this simple failure pattern or the Hikkake pattern.)
- Do not overwhelm yourself with indicators. Instead, consider the value of every single indicator you add to your chart. Does it add value? Remember to trade simply.
Even with effective indicators, the most consistent traders never forget to analyze price action itself. Learn the essentials from our vast price action trading resources.
The article was first published on 18 December 2013 and updated on 22 December 2021.